29
/it/
it
AIzaSyAYiBZKx7MnpbEhh9jyipgxe19OcubqV5w
April 1, 2024
278945
Uzbekistan
UZB
true
2
1
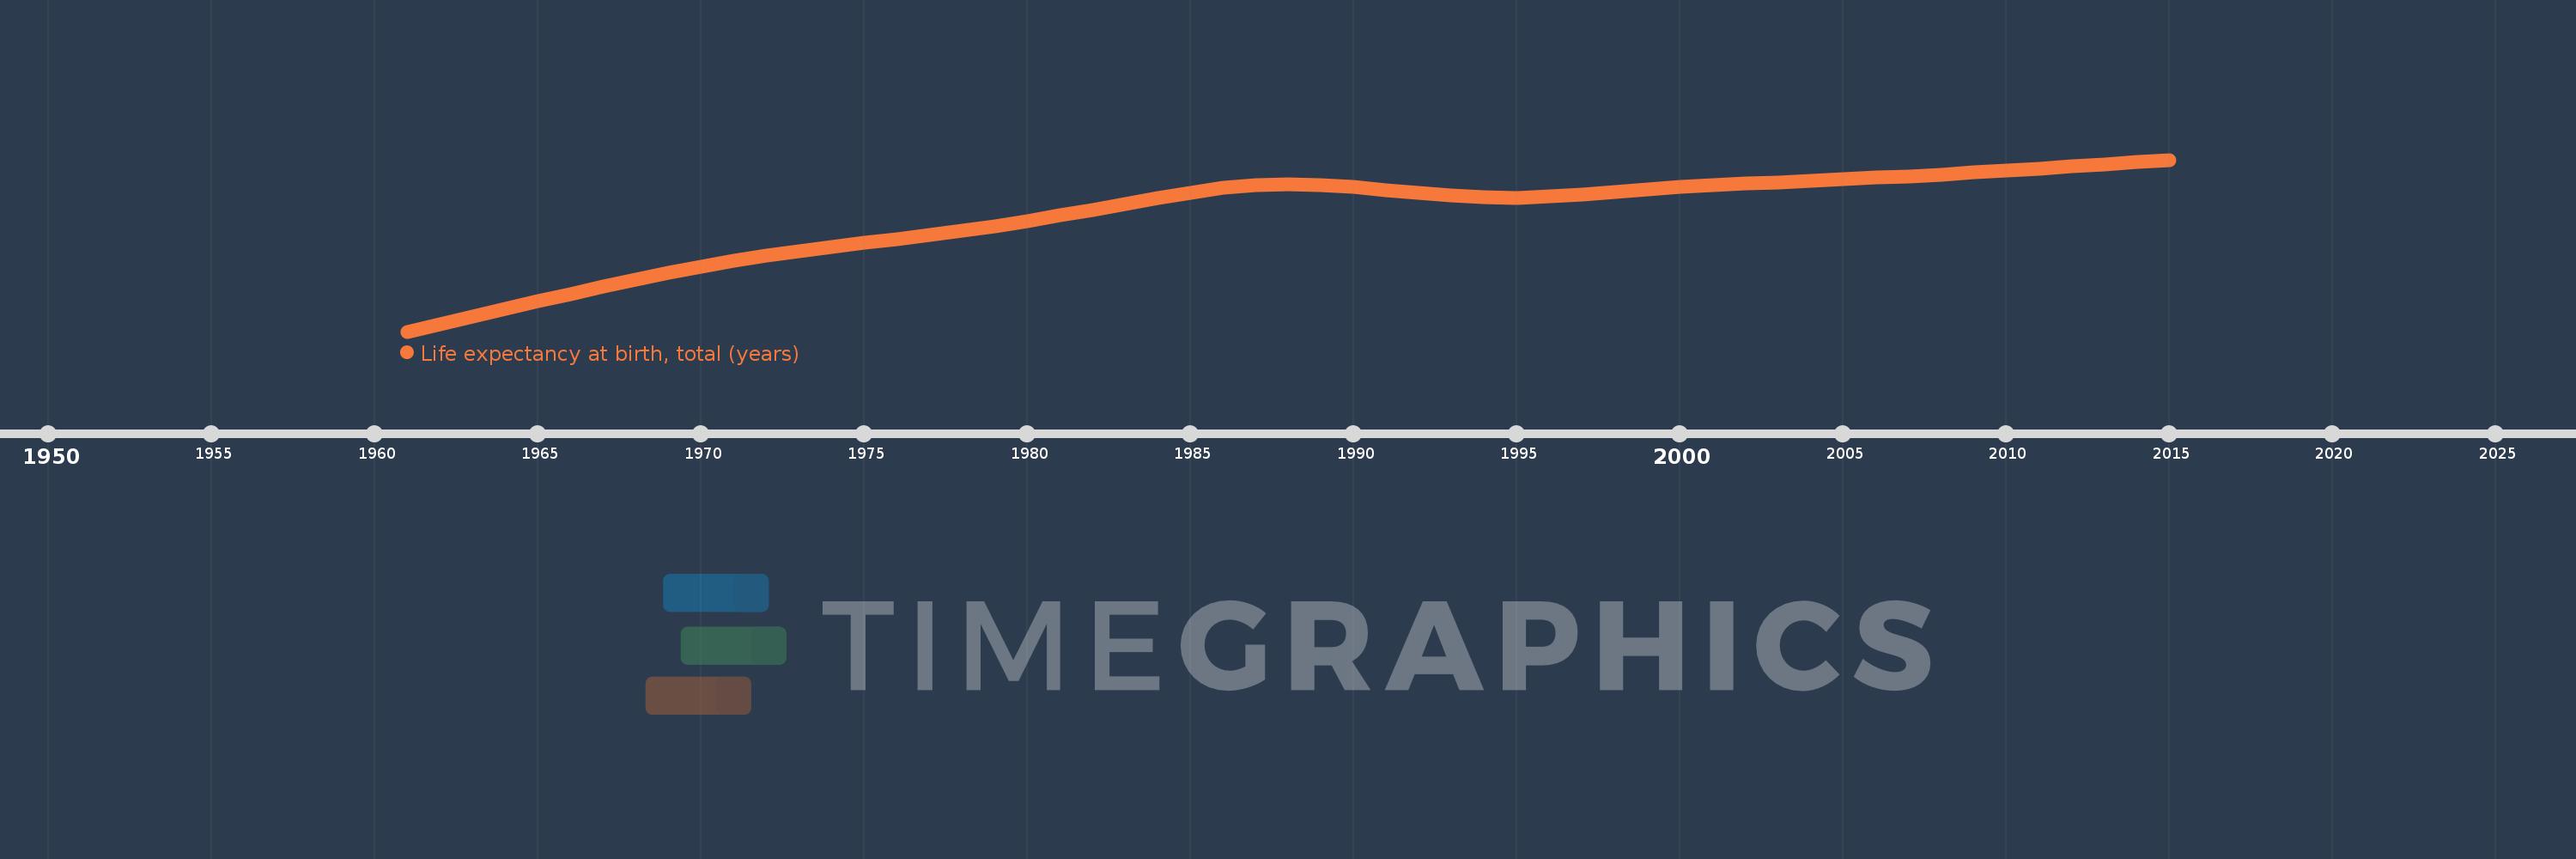
Life expectancy at birth, total (years)
2015,2014,2013,2012,2011,2010,2009,2008,2007,2006,2005,2004,2003,2002,2001,2000,1999,1998,1997,1996,1995,1994,1993,1992,1991,1990,1989,1988,1987,1986,1985,1984,1983,1982,1981,1980,1979,1978,1977,1976,1975,1974,1973,1972,1971,1970,1969,1968,1967,1966,1965,1964,1963,1962,1961
Queste statistiche in altri paesi:
AfghanistanAlbaniaAlgeriaAngolaAntigua and BarbudaArab WorldArgentinaArmeniaArubaAustraliaAustriaAzerbaijanBahamas, TheBahrainBangladeshBarbadosBelarusBelgiumBelizeBeninBermudaBhutanBoliviaBosnia and HerzegovinaBotswanaBrazilBrunei DarussalamBulgariaBurkina FasoBurundiCabo VerdeCambodiaCameroonCanadaCaribbean small statesCentral African RepublicCentral Europe and the BalticsChadChannel IslandsChileChinaColombiaComorosCongo, Dem. Rep.Congo, Rep.Costa RicaCote d'IvoireCroatiaCubaCuracaoCyprusCzech RepublicDenmarkDjiboutiDominicaDominican RepublicEarly-demographic dividendEast Asia & PacificEast Asia & Pacific (excluding high income)East Asia & Pacific (IDA & IBRD countries)EcuadorEgypt, Arab Rep.El SalvadorEquatorial GuineaEritreaEstoniaEthiopiaEuro areaEurope & Central AsiaEurope & Central Asia (excluding high income)Europe & Central Asia (IDA & IBRD countries)European UnionFaroe IslandsFijiFinlandFragile and conflict affected situationsFranceFrench PolynesiaGabonGambia, TheGeorgiaGermanyGhanaGreeceGreenlandGrenadaGuamGuatemalaGuineaGuinea-BissauGuyanaHaitiHeavily indebted poor countries (HIPC)High incomeHondurasHong Kong SAR, ChinaHungaryIBRD onlyIcelandIDA & IBRD totalIDA blendIDA onlyIDA totalIndiaIndonesiaIran, Islamic Rep.IraqIrelandIsle of ManIsraelItalyJamaicaJapanJordanKazakhstanKenyaKiribatiKorea, Dem. People’s Rep.Korea, Rep.KosovoKuwaitKyrgyz RepublicLao PDRLate-demographic dividendLatin America & Caribbean Latin America & Caribbean (excluding high income)Latin America & the Caribbean (IDA & IBRD countries)LatviaLeast developed countries: UN classificationLebanonLesothoLiberiaLibyaLiechtensteinLithuaniaLow & middle incomeLow incomeLower middle incomeLuxembourgMacao SAR, ChinaMacedonia, FYRMadagascarMalawiMalaysiaMaldivesMaliMaltaMarshall IslandsMauritaniaMauritiusMexicoMicronesia, Fed. Sts.Middle East & North AfricaMiddle East & North Africa (excluding high income)Middle East & North Africa (IDA & IBRD countries)Middle incomeMoldovaMongoliaMontenegroMoroccoMozambiqueMyanmarNamibiaNepalNetherlandsNew CaledoniaNew ZealandNicaraguaNigerNigeriaNorth AmericaNorwayOECD membersOmanOther small statesPacific island small statesPakistanPalauPanamaPapua New GuineaParaguayPeruPhilippinesPolandPortugalPost-demographic dividendPre-demographic dividendPuerto RicoQatarRomaniaRussian FederationRwandaSamoaSan MarinoSao Tome and PrincipeSaudi ArabiaSenegalSerbiaSeychellesSierra LeoneSingaporeSint Maarten (Dutch part)Slovak RepublicSloveniaSmall statesSolomon IslandsSomaliaSouth AfricaSouth AsiaSouth Asia (IDA & IBRD)South SudanSpainSri LankaSt. Kitts and NevisSt. LuciaSt. Martin (French part)St. Vincent and the GrenadinesSub-Saharan Africa Sub-Saharan Africa (excluding high income)Sub-Saharan Africa (IDA & IBRD countries)SudanSurinameSwazilandSwedenSwitzerlandSyrian Arab RepublicTajikistanTanzaniaThailandTimor-LesteTogoTongaTrinidad and TobagoTunisiaTurkeyTurkmenistanUgandaUkraineUnited Arab EmiratesUnited KingdomUnited StatesUpper middle incomeUruguayUzbekistanVanuatuVenezuela, RBVietnamVirgin Islands (U.S.)West Bank and GazaWorldYemen, Rep.ZambiaZimbabwe Linea del tempo:
Questa scala temporale mostra un grafico dal 1961 anno al 2015 anno. Uzbekistan. I dati fino ad 1960 anno non disponibili. Il numero di osservazioni attuali secondo i date: 55.
La fonte (nome):
Indicatori dello sviluppo mondiale
La fonte (organizzazione):
Derived from male and female life expectancy at birth from sources such as: (1) United Nations Population Division. World Population Prospects, (2) Census reports and other statistical publications from national statistical offices, (3) Eurostat: Demographic Statistics, (4) United Nations Statistical Division. Population and Vital Statistics Reprot (various years), (5) U.S. Census Bureau: International Database, and (6) Secretariat of the Pacific Community: Statistics and Demography Programme.
Categorie:
Health
sono stati aggiornati
23 apr 2017 anni
Indicatori delle variazioni dei valori per anni
Minima:
58.886
1 gen 1961 anni
Massimo:
68.339
1 gen 2015 anni
Alla data di osservazione
Valore
Variazione assoluta
La variazione rispetto al valore precedente
1 gen 1961 anni
58.886
+58.886
0.0%
1 gen 1962 anni
59.298
+0.412
0.7%
1 gen 1963 anni
59.713
+0.415
0.7%
1 gen 1964 anni
60.13
+0.417
0.7%
1 gen 1965 anni
60.547
+0.417
0.69%
1 gen 1966 anni
60.957
+0.411
0.68%
1 gen 1967 anni
61.358
+0.401
0.66%
1 gen 1968 anni
61.744
+0.387
0.63%
1 gen 1969 anni
62.111
+0.367
0.59%
1 gen 1970 anni
62.456
+0.345
0.56%
1 gen 1971 anni
62.774
+0.318
0.51%
1 gen 1972 anni
63.062
+0.288
0.46%
1 gen 1973 anni
63.32
+0.259
0.41%
1 gen 1974 anni
63.556
+0.236
0.37%
1 gen 1975 anni
63.775
+0.219
0.34%
1 gen 1976 anni
63.988
+0.213
0.33%
1 gen 1977 anni
64.208
+0.22
0.34%
1 gen 1978 anni
64.443
+0.235
0.37%
1 gen 1979 anni
64.698
+0.255
0.4%
1 gen 1980 anni
64.974
+0.276
0.43%
1 gen 1981 anni
65.272
+0.298
0.46%
1 gen 1982 anni
65.593
+0.32
0.49%
1 gen 1983 anni
65.922
+0.33
0.5%
1 gen 1984 anni
66.244
+0.322
0.49%
1 gen 1985 anni
66.542
+0.298
0.45%
1 gen 1986 anni
66.785
+0.243
0.37%
1 gen 1987 anni
66.942
+0.157
0.24%
1 gen 1988 anni
67.003
+0.06
0.09%
1 gen 1989 anni
66.968
-0.034
-0.05%
1 gen 1990 anni
66.852
-0.116
-0.17%
1 gen 1991 anni
66.684
-0.168
-0.25%
1 gen 1992 anni
66.506
-0.178
-0.27%
1 gen 1993 anni
66.359
-0.147
-0.22%
1 gen 1994 anni
66.272
-0.087
-0.13%
1 gen 1995 anni
66.259
-0.013
-0.02%
1 gen 1996 anni
66.317
+0.058
0.09%
1 gen 1997 anni
66.432
+0.115
0.17%
1 gen 1998 anni
66.571
+0.139
0.21%
1 gen 1999 anni
66.709
+0.138
0.21%
1 gen 2000 anni
66.833
+0.125
0.19%
1 gen 2001 anni
66.941
+0.107
0.16%
1 gen 2002 anni
67.029
+0.088
0.13%
1 gen 2003 anni
67.108
+0.079
0.12%
1 gen 2004 anni
67.187
+0.078
0.12%
1 gen 2005 anni
67.265
+0.078
0.12%
1 gen 2006 anni
67.347
+0.082
0.12%
1 gen 2007 anni
67.435
+0.088
0.13%
1 gen 2008 anni
67.531
+0.096
0.14%
1 gen 2009 anni
67.634
+0.103
0.15%
1 gen 2010 anni
67.745
+0.11
0.16%
1 gen 2011 anni
67.861
+0.117
0.17%
1 gen 2012 anni
67.981
+0.12
0.18%
1 gen 2013 anni
68.102
+0.121
0.18%
1 gen 2014 anni
68.222
+0.12
0.18%
1 gen 2015 anni
68.339
+0.117
0.17%
Classificazione dei paesi secondo i statistiche attuali per anni


Commenti: