29
/it/
it
AIzaSyAYiBZKx7MnpbEhh9jyipgxe19OcubqV5w
April 1, 2024
153746
Iceland
ISL
true
2
1
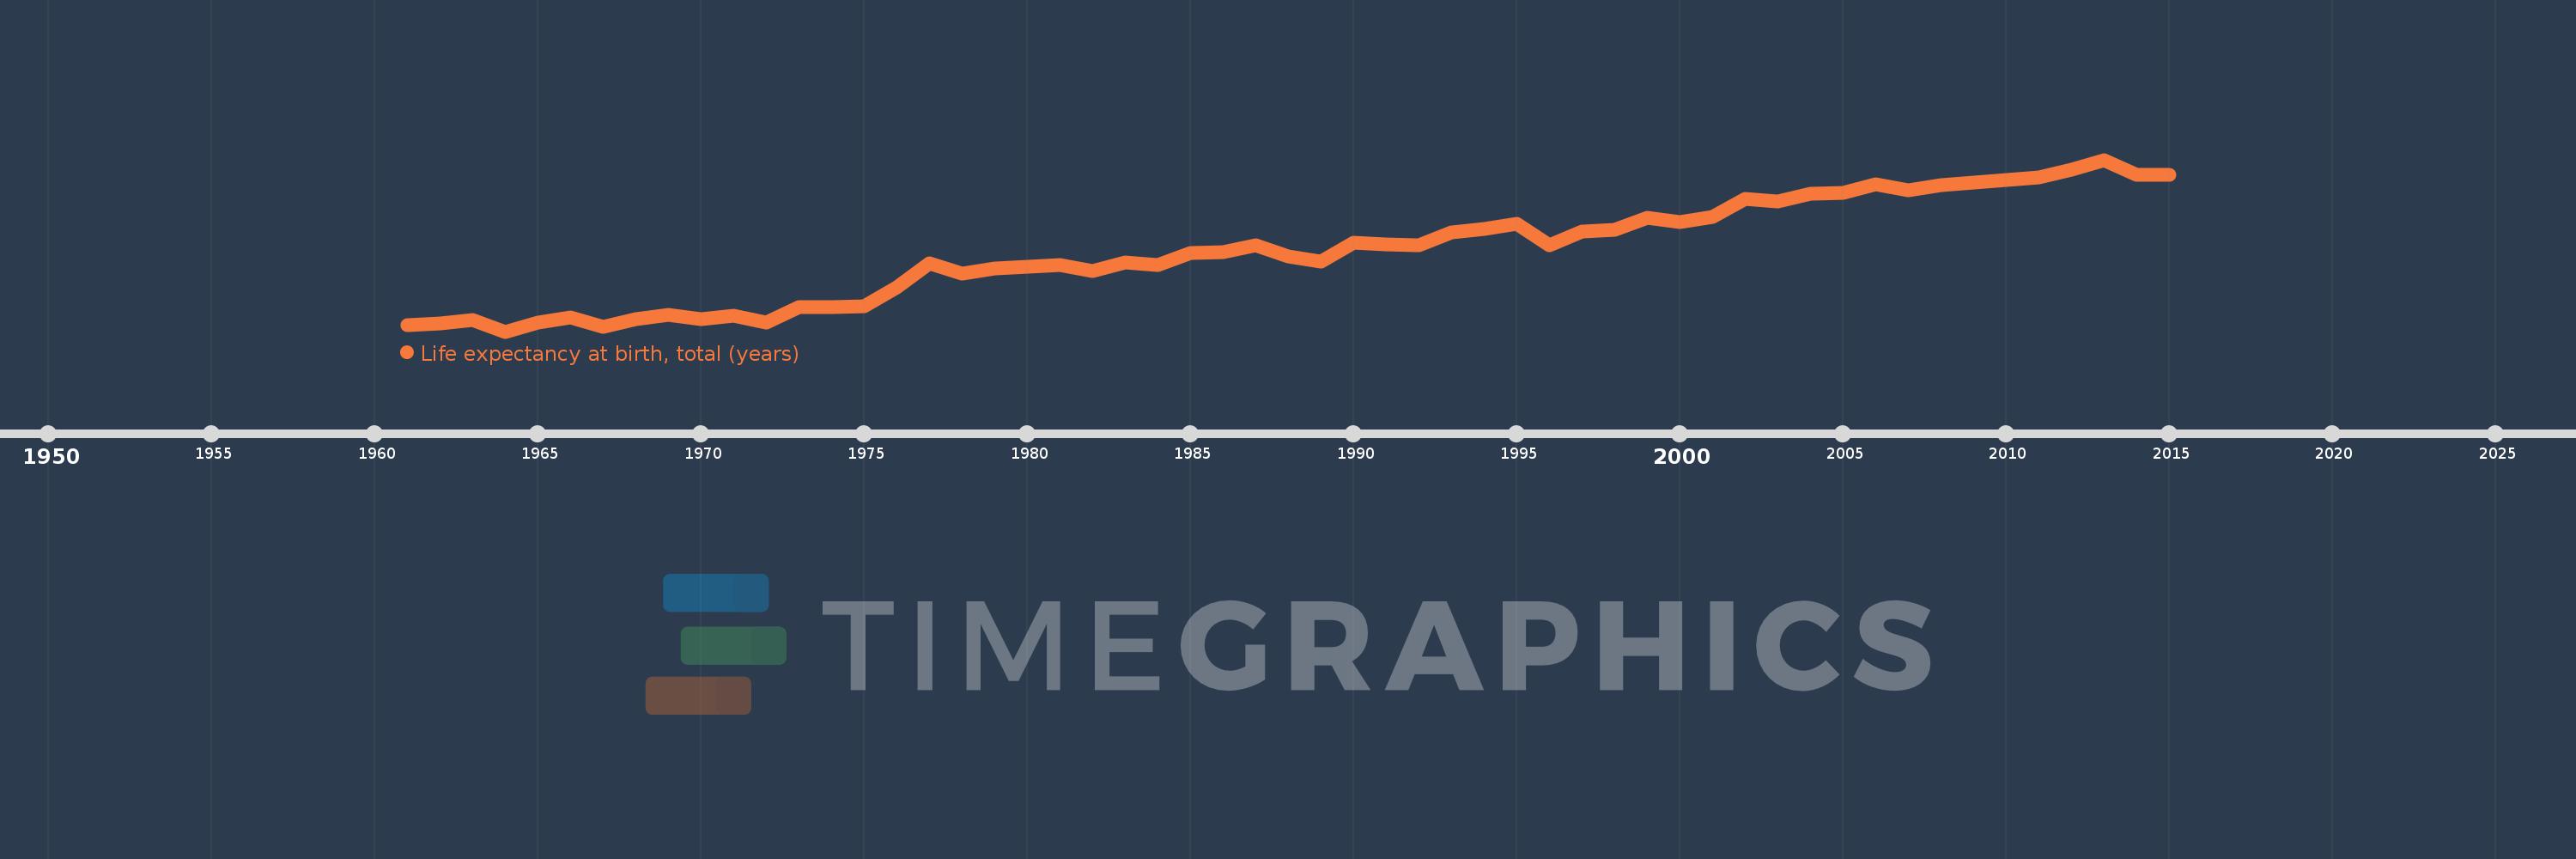
Life expectancy at birth, total (years)
2015,2014,2013,2012,2011,2010,2009,2008,2007,2006,2005,2004,2003,2002,2001,2000,1999,1998,1997,1996,1995,1994,1993,1992,1991,1990,1989,1988,1987,1986,1985,1984,1983,1982,1981,1980,1979,1978,1977,1976,1975,1974,1973,1972,1971,1970,1969,1968,1967,1966,1965,1964,1963,1962,1961
Queste statistiche in altri paesi:
AfghanistanAlbaniaAlgeriaAngolaAntigua and BarbudaArab WorldArgentinaArmeniaArubaAustraliaAustriaAzerbaijanBahamas, TheBahrainBangladeshBarbadosBelarusBelgiumBelizeBeninBermudaBhutanBoliviaBosnia and HerzegovinaBotswanaBrazilBrunei DarussalamBulgariaBurkina FasoBurundiCabo VerdeCambodiaCameroonCanadaCaribbean small statesCentral African RepublicCentral Europe and the BalticsChadChannel IslandsChileChinaColombiaComorosCongo, Dem. Rep.Congo, Rep.Costa RicaCote d'IvoireCroatiaCubaCuracaoCyprusCzech RepublicDenmarkDjiboutiDominicaDominican RepublicEarly-demographic dividendEast Asia & PacificEast Asia & Pacific (excluding high income)East Asia & Pacific (IDA & IBRD countries)EcuadorEgypt, Arab Rep.El SalvadorEquatorial GuineaEritreaEstoniaEthiopiaEuro areaEurope & Central AsiaEurope & Central Asia (excluding high income)Europe & Central Asia (IDA & IBRD countries)European UnionFaroe IslandsFijiFinlandFragile and conflict affected situationsFranceFrench PolynesiaGabonGambia, TheGeorgiaGermanyGhanaGreeceGreenlandGrenadaGuamGuatemalaGuineaGuinea-BissauGuyanaHaitiHeavily indebted poor countries (HIPC)High incomeHondurasHong Kong SAR, ChinaHungaryIBRD onlyIcelandIDA & IBRD totalIDA blendIDA onlyIDA totalIndiaIndonesiaIran, Islamic Rep.IraqIrelandIsle of ManIsraelItalyJamaicaJapanJordanKazakhstanKenyaKiribatiKorea, Dem. People’s Rep.Korea, Rep.KosovoKuwaitKyrgyz RepublicLao PDRLate-demographic dividendLatin America & Caribbean Latin America & Caribbean (excluding high income)Latin America & the Caribbean (IDA & IBRD countries)LatviaLeast developed countries: UN classificationLebanonLesothoLiberiaLibyaLiechtensteinLithuaniaLow & middle incomeLow incomeLower middle incomeLuxembourgMacao SAR, ChinaMacedonia, FYRMadagascarMalawiMalaysiaMaldivesMaliMaltaMarshall IslandsMauritaniaMauritiusMexicoMicronesia, Fed. Sts.Middle East & North AfricaMiddle East & North Africa (excluding high income)Middle East & North Africa (IDA & IBRD countries)Middle incomeMoldovaMongoliaMontenegroMoroccoMozambiqueMyanmarNamibiaNepalNetherlandsNew CaledoniaNew ZealandNicaraguaNigerNigeriaNorth AmericaNorwayOECD membersOmanOther small statesPacific island small statesPakistanPalauPanamaPapua New GuineaParaguayPeruPhilippinesPolandPortugalPost-demographic dividendPre-demographic dividendPuerto RicoQatarRomaniaRussian FederationRwandaSamoaSan MarinoSao Tome and PrincipeSaudi ArabiaSenegalSerbiaSeychellesSierra LeoneSingaporeSint Maarten (Dutch part)Slovak RepublicSloveniaSmall statesSolomon IslandsSomaliaSouth AfricaSouth AsiaSouth Asia (IDA & IBRD)South SudanSpainSri LankaSt. Kitts and NevisSt. LuciaSt. Martin (French part)St. Vincent and the GrenadinesSub-Saharan Africa Sub-Saharan Africa (excluding high income)Sub-Saharan Africa (IDA & IBRD countries)SudanSurinameSwazilandSwedenSwitzerlandSyrian Arab RepublicTajikistanTanzaniaThailandTimor-LesteTogoTongaTrinidad and TobagoTunisiaTurkeyTurkmenistanUgandaUkraineUnited Arab EmiratesUnited KingdomUnited StatesUpper middle incomeUruguayUzbekistanVanuatuVenezuela, RBVietnamVirgin Islands (U.S.)West Bank and GazaWorldYemen, Rep.ZambiaZimbabwe Linea del tempo:
Questa scala temporale mostra un grafico dal 1961 anno al 2015 anno. Iceland. I dati fino ad 1960 anno non disponibili. Il numero di osservazioni attuali secondo i date: 55.
La fonte (nome):
Indicatori dello sviluppo mondiale
La fonte (organizzazione):
Derived from male and female life expectancy at birth from sources such as: (1) United Nations Population Division. World Population Prospects, (2) Census reports and other statistical publications from national statistical offices, (3) Eurostat: Demographic Statistics, (4) United Nations Statistical Division. Population and Vital Statistics Reprot (various years), (5) U.S. Census Bureau: International Database, and (6) Secretariat of the Pacific Community: Statistics and Demography Programme.
Categorie:
Health
sono stati aggiornati
23 apr 2017 anni
Indicatori delle variazioni dei valori per anni
Minima:
73.043
1 gen 1964 anni
Massimo:
82.917
1 gen 2013 anni
Alla data di osservazione
Valore
Variazione assoluta
La variazione rispetto al valore precedente
1 gen 1961 anni
73.429
+73.429
0.0%
1 gen 1962 anni
73.503
+0.075
0.1%
1 gen 1963 anni
73.722
+0.219
0.3%
1 gen 1964 anni
73.043
-0.679
-0.92%
1 gen 1965 anni
73.542
+0.499
0.68%
1 gen 1966 anni
73.869
+0.327
0.44%
1 gen 1967 anni
73.3
-0.568
-0.77%
1 gen 1968 anni
73.783
+0.483
0.66%
1 gen 1969 anni
74.006
+0.223
0.3%
1 gen 1970 anni
73.776
-0.23
-0.31%
1 gen 1971 anni
73.934
+0.158
0.21%
1 gen 1972 anni
73.57
-0.363
-0.49%
1 gen 1973 anni
74.456
+0.885
1.2%
1 gen 1974 anni
74.451
-0.005
-0.01%
1 gen 1975 anni
74.512
+0.061
0.08%
1 gen 1976 anni
75.579
+1.067
1.43%
1 gen 1977 anni
76.972
+1.393
1.84%
1 gen 1978 anni
76.374
-0.599
-0.78%
1 gen 1979 anni
76.649
+0.276
0.36%
1 gen 1980 anni
76.773
+0.124
0.16%
1 gen 1981 anni
76.847
+0.073
0.1%
1 gen 1982 anni
76.521
-0.325
-0.42%
1 gen 1983 anni
77.038
+0.516
0.67%
1 gen 1984 anni
76.846
-0.192
-0.25%
1 gen 1985 anni
77.577
+0.731
0.95%
1 gen 1986 anni
77.602
+0.026
0.03%
1 gen 1987 anni
77.991
+0.388
0.5%
1 gen 1988 anni
77.339
-0.652
-0.84%
1 gen 1989 anni
77.083
-0.256
-0.33%
1 gen 1990 anni
78.141
+1.058
1.37%
1 gen 1991 anni
78.036
-0.105
-0.13%
1 gen 1992 anni
77.992
-0.044
-0.06%
1 gen 1993 anni
78.76
+0.768
0.99%
1 gen 1994 anni
78.935
+0.174
0.22%
1 gen 1995 anni
79.247
+0.312
0.4%
1 gen 1996 anni
77.984
-1.263
-1.59%
1 gen 1997 anni
78.778
+0.793
1.02%
1 gen 1998 anni
78.885
+0.108
0.14%
1 gen 1999 anni
79.602
+0.717
0.91%
1 gen 2000 anni
79.351
-0.251
-0.32%
1 gen 2001 anni
79.654
+0.302
0.38%
1 gen 2002 anni
80.69
+1.037
1.3%
1 gen 2003 anni
80.502
-0.188
-0.23%
1 gen 2004 anni
80.963
+0.461
0.57%
1 gen 2005 anni
80.998
+0.034
0.04%
1 gen 2006 anni
81.502
+0.505
0.62%
1 gen 2007 anni
81.159
-0.344
-0.42%
1 gen 2008 anni
81.454
+0.295
0.36%
1 gen 2009 anni
81.61
+0.156
0.19%
1 gen 2010 anni
81.751
+0.141
0.17%
1 gen 2011 anni
81.898
+0.146
0.18%
1 gen 2012 anni
82.359
+0.461
0.56%
1 gen 2013 anni
82.917
+0.559
0.68%
1 gen 2014 anni
82.061
-0.856
-1.03%
1 gen 2015 anni
82.061
0.0
0.0%
Classificazione dei paesi secondo i statistiche attuali per anni


Commenti: