29
/it/
it
AIzaSyAYiBZKx7MnpbEhh9jyipgxe19OcubqV5w
April 1, 2024
53277
Other small states
OSS
false
2
1
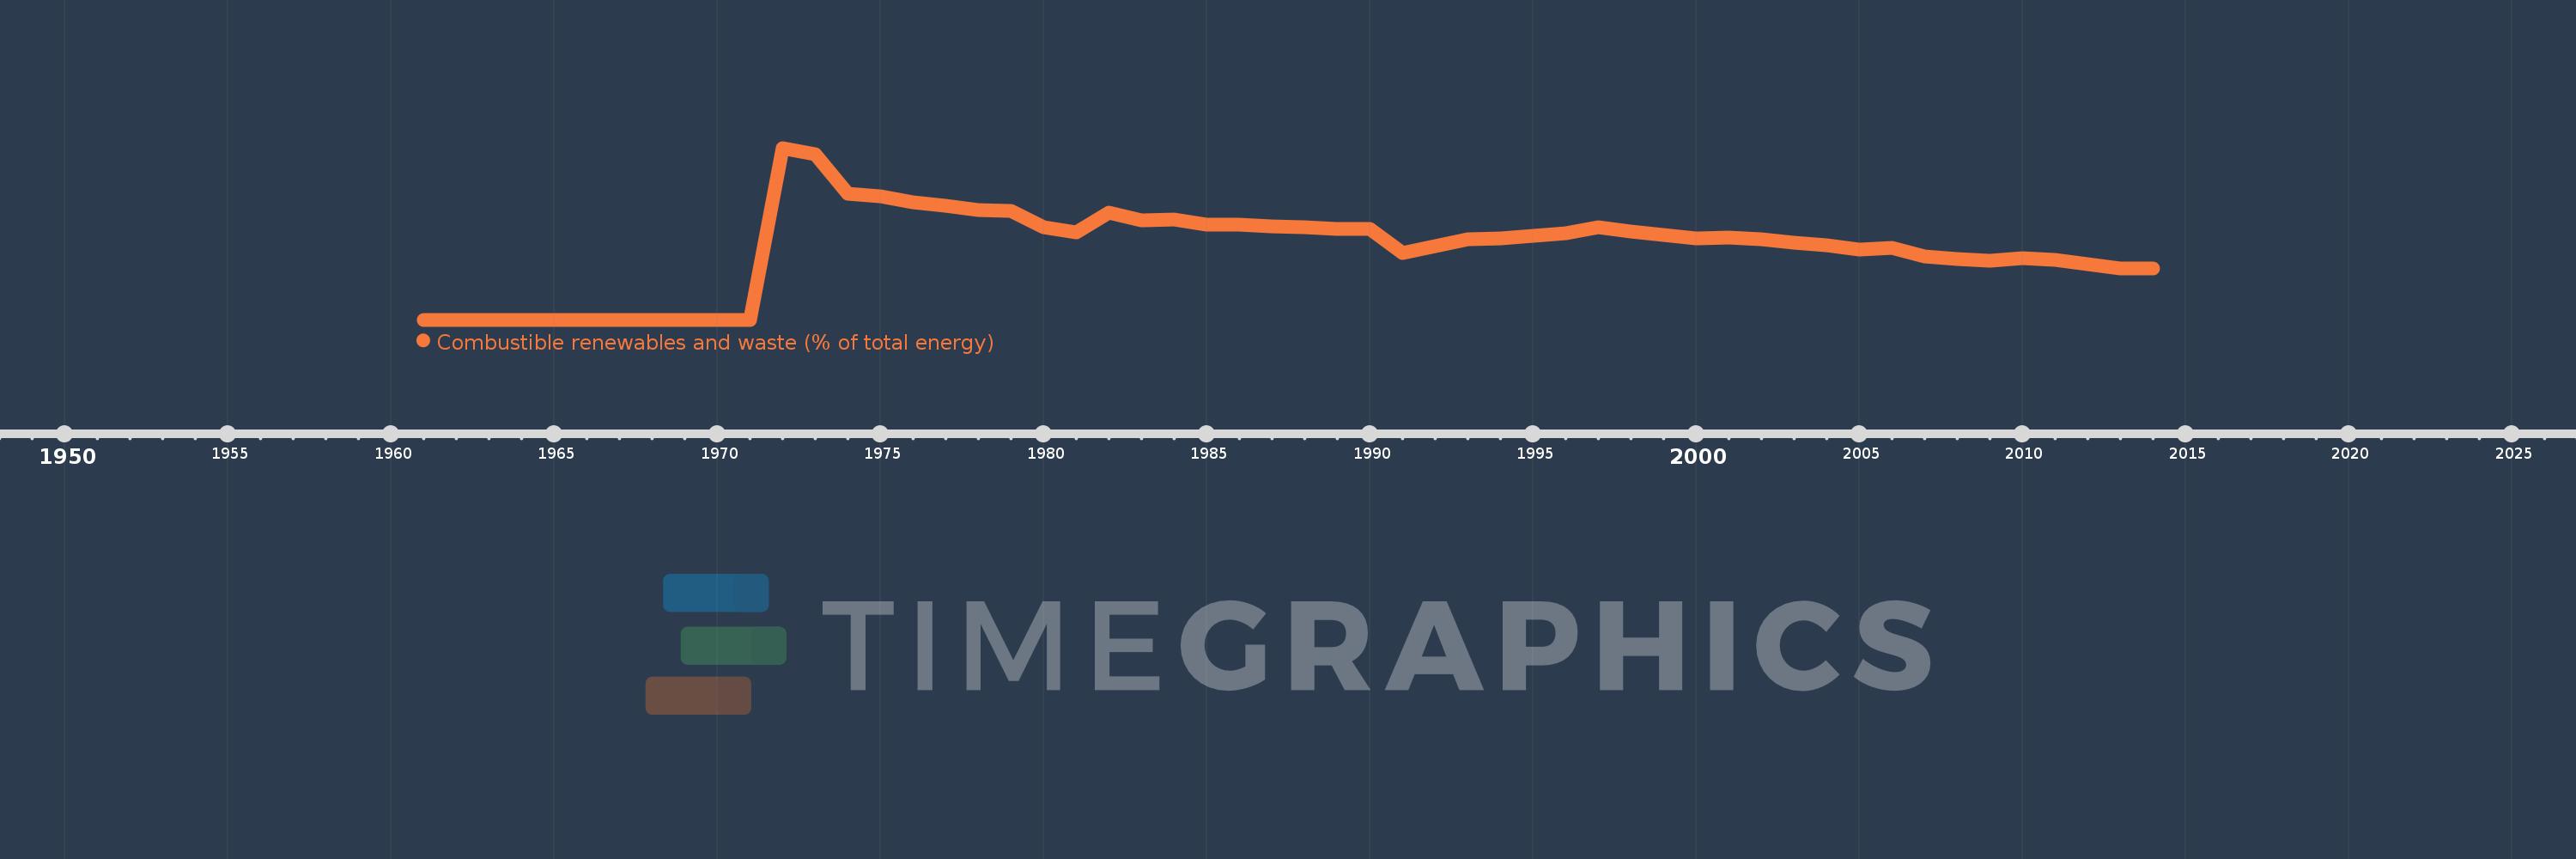
Combustible renewables and waste (% of total energy)
2014,2013,2012,2011,2010,2009,2008,2007,2006,2005,2004,2003,2002,2001,2000,1999,1998,1997,1996,1995,1994,1993,1992,1991,1990,1989,1988,1987,1986,1985,1984,1983,1982,1981,1980,1979,1978,1977,1976,1975,1974,1973,1972,1971,1970,1969,1968,1967,1966,1965,1964,1963,1962,1961
Queste statistiche in altri paesi:
AlbaniaAlgeriaAngolaArab WorldArgentinaArmeniaAustraliaAustriaAzerbaijanBahrainBangladeshBelarusBelgiumBeninBoliviaBosnia and HerzegovinaBotswanaBrazilBrunei DarussalamBulgariaCambodiaCameroonCanadaCaribbean small statesCentral Europe and the BalticsChileChinaColombiaCongo, Dem. Rep.Congo, Rep.Costa RicaCote d'IvoireCroatiaCubaCuracaoCyprusCzech RepublicDenmarkDominican RepublicEarly-demographic dividendEast Asia & PacificEast Asia & Pacific (excluding high income)East Asia & Pacific (IDA & IBRD countries)EcuadorEgypt, Arab Rep.El SalvadorEritreaEstoniaEthiopiaEuro areaEurope & Central AsiaEurope & Central Asia (excluding high income)Europe & Central Asia (IDA & IBRD countries)European UnionFinlandFragile and conflict affected situationsFranceGabonGeorgiaGermanyGhanaGibraltarGreeceGuatemalaHaitiHeavily indebted poor countries (HIPC)High incomeHondurasHong Kong SAR, ChinaHungaryIBRD onlyIcelandIDA & IBRD totalIDA blendIDA onlyIDA totalIndiaIndonesiaIran, Islamic Rep.IraqIrelandIsraelItalyJamaicaJapanJordanKazakhstanKenyaKorea, Dem. People’s Rep.Korea, Rep.KosovoKuwaitKyrgyz RepublicLate-demographic dividendLatin America & Caribbean Latin America & Caribbean (excluding high income)Latin America & the Caribbean (IDA & IBRD countries)LatviaLeast developed countries: UN classificationLebanonLibyaLithuaniaLow & middle incomeLow incomeLower middle incomeLuxembourgMacedonia, FYRMalaysiaMaltaMauritiusMexicoMiddle East & North AfricaMiddle East & North Africa (excluding high income)Middle East & North Africa (IDA & IBRD countries)Middle incomeMoldovaMongoliaMontenegroMoroccoMozambiqueMyanmarNamibiaNepalNetherlandsNew ZealandNicaraguaNigerNigeriaNorth AmericaNorwayOECD membersOmanOther small statesPakistanPanamaParaguayPeruPhilippinesPolandPortugalPost-demographic dividendPre-demographic dividendQatarRomaniaRussian FederationSaudi ArabiaSenegalSerbiaSingaporeSlovak RepublicSloveniaSmall statesSouth AfricaSouth AsiaSouth Asia (IDA & IBRD)South SudanSpainSri LankaSub-Saharan Africa Sub-Saharan Africa (excluding high income)Sub-Saharan Africa (IDA & IBRD countries)SudanSwedenSwitzerlandSyrian Arab RepublicTajikistanTanzaniaThailandTogoTrinidad and TobagoTunisiaTurkeyTurkmenistanUkraineUnited Arab EmiratesUnited KingdomUnited StatesUpper middle incomeUruguayUzbekistanVenezuela, RBVietnamWorldYemen, Rep.ZambiaZimbabwe Linea del tempo:
Questa scala temporale mostra un grafico dal 1961 anno al 2014 anno. Other small states. I dati fino ad 1960 anno non disponibili. Il numero di osservazioni attuali secondo i date: 54.
La fonte (nome):
Indicatori dello sviluppo mondiale
La fonte (organizzazione):
IEA Statistics © OECD/IEA 2014 (http://www.iea.org/stats/index.asp), subject to https://www.iea.org/t&c/termsandconditions/
Categorie:
Energy & Mining
sono stati aggiornati
23 apr 2017 anni
Indicatori delle variazioni dei valori per anni
Minima:
0.0
1 gen 1961 anni
Massimo:
13.918
1 gen 1972 anni
Alla data di osservazione
Valore
Variazione assoluta
La variazione rispetto al valore precedente
1 gen 1961 anni
0.0
0.0
0.0%
1 gen 1972 anni
13.918
+13.918
%
1 gen 1973 anni
13.386
-0.532
-3.82%
1 gen 1974 anni
10.239
-3.147
-23.51%
1 gen 1975 anni
10.003
-0.236
-2.31%
1 gen 1976 anni
9.538
-0.465
-4.65%
1 gen 1977 anni
9.204
-0.333
-3.5%
1 gen 1978 anni
8.898
-0.307
-3.33%
1 gen 1979 anni
8.802
-0.096
-1.08%
1 gen 1980 anni
7.469
-1.333
-15.14%
1 gen 1981 anni
7.074
-0.395
-5.29%
1 gen 1982 anni
8.648
+1.574
22.25%
1 gen 1983 anni
8.071
-0.577
-6.67%
1 gen 1984 anni
8.125
+0.055
0.68%
1 gen 1985 anni
7.679
-0.447
-5.5%
1 gen 1986 anni
7.718
+0.039
0.51%
1 gen 1987 anni
7.538
-0.181
-2.34%
1 gen 1988 anni
7.47
-0.068
-0.9%
1 gen 1989 anni
7.387
-0.083
-1.11%
1 gen 1990 anni
7.373
-0.013
-0.18%
1 gen 1991 anni
5.378
-1.996
-27.07%
1 gen 1992 anni
5.971
+0.594
11.04%
1 gen 1993 anni
6.505
+0.534
8.94%
1 gen 1994 anni
6.563
+0.057
0.88%
1 gen 1995 anni
6.784
+0.221
3.37%
1 gen 1996 anni
6.982
+0.198
2.92%
1 gen 1997 anni
7.517
+0.534
7.65%
1 gen 1998 anni
7.118
-0.398
-5.3%
1 gen 1999 anni
6.838
-0.28
-3.94%
1 gen 2000 anni
6.603
-0.234
-3.43%
1 gen 2001 anni
6.633
+0.029
0.44%
1 gen 2002 anni
6.529
-0.104
-1.56%
1 gen 2003 anni
6.271
-0.259
-3.96%
1 gen 2004 anni
6.062
-0.209
-3.33%
1 gen 2005 anni
5.68
-0.382
-6.3%
1 gen 2006 anni
5.793
+0.113
1.99%
1 gen 2007 anni
5.138
-0.655
-11.31%
1 gen 2008 anni
4.905
-0.233
-4.54%
1 gen 2009 anni
4.806
-0.098
-2.01%
1 gen 2010 anni
4.978
+0.172
3.57%
1 gen 2011 anni
4.83
-0.148
-2.98%
1 gen 2012 anni
4.471
-0.358
-7.42%
1 gen 2013 anni
4.166
-0.305
-6.82%
1 gen 2014 anni
4.135
-0.031
-0.76%
Classificazione dei paesi secondo i statistiche attuali per anni


Commenti: