29
/it/
it
AIzaSyAYiBZKx7MnpbEhh9jyipgxe19OcubqV5w
April 1, 2024
23962
Arab World
ARB
false
2
1
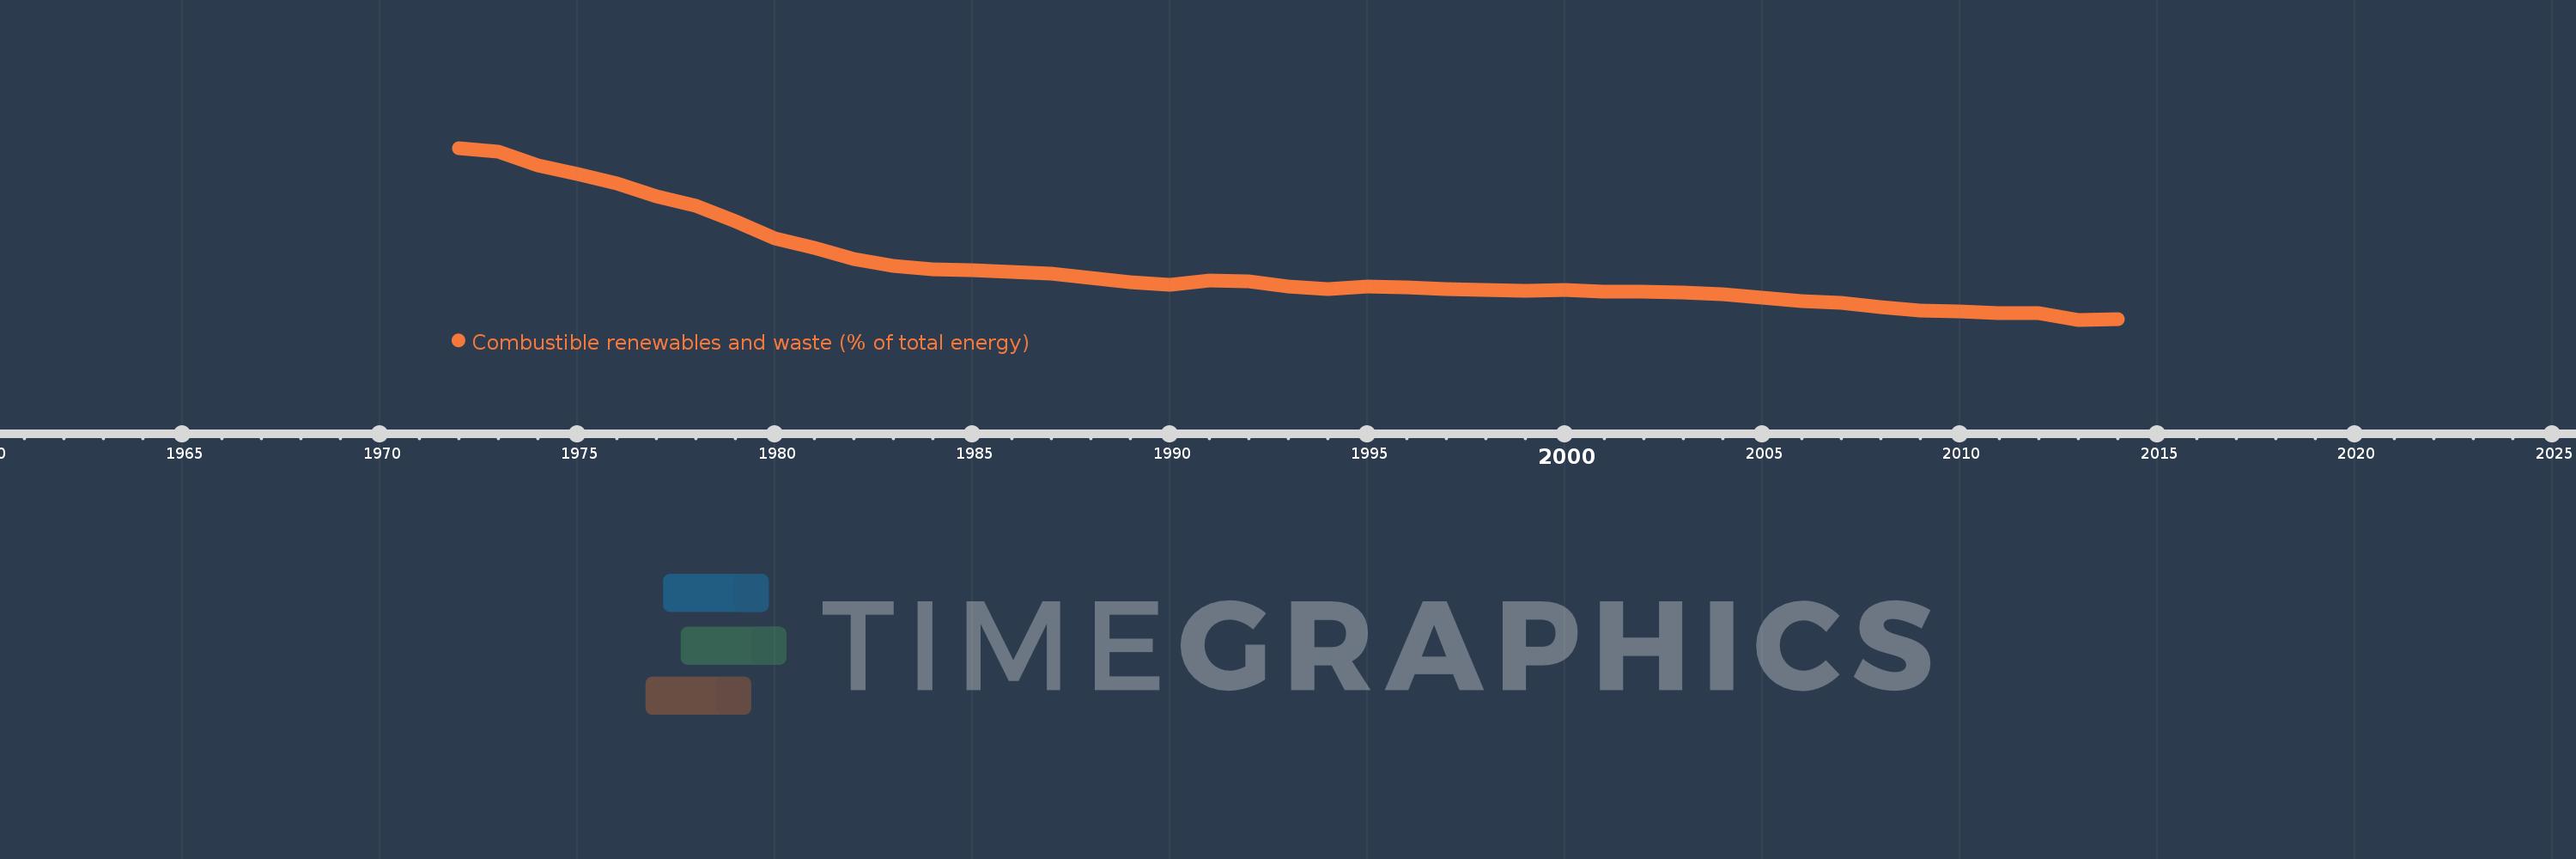
Combustible renewables and waste (% of total energy)
2014,2013,2012,2011,2010,2009,2008,2007,2006,2005,2004,2003,2002,2001,2000,1999,1998,1997,1996,1995,1994,1993,1992,1991,1990,1989,1988,1987,1986,1985,1984,1983,1982,1981,1980,1979,1978,1977,1976,1975,1974,1973,1972
Queste statistiche in altri paesi:
AlbaniaAlgeriaAngolaArab WorldArgentinaArmeniaAustraliaAustriaAzerbaijanBahrainBangladeshBelarusBelgiumBeninBoliviaBosnia and HerzegovinaBotswanaBrazilBrunei DarussalamBulgariaCambodiaCameroonCanadaCaribbean small statesCentral Europe and the BalticsChileChinaColombiaCongo, Dem. Rep.Congo, Rep.Costa RicaCote d'IvoireCroatiaCubaCuracaoCyprusCzech RepublicDenmarkDominican RepublicEarly-demographic dividendEast Asia & PacificEast Asia & Pacific (excluding high income)East Asia & Pacific (IDA & IBRD countries)EcuadorEgypt, Arab Rep.El SalvadorEritreaEstoniaEthiopiaEuro areaEurope & Central AsiaEurope & Central Asia (excluding high income)Europe & Central Asia (IDA & IBRD countries)European UnionFinlandFragile and conflict affected situationsFranceGabonGeorgiaGermanyGhanaGibraltarGreeceGuatemalaHaitiHeavily indebted poor countries (HIPC)High incomeHondurasHong Kong SAR, ChinaHungaryIBRD onlyIcelandIDA & IBRD totalIDA blendIDA onlyIDA totalIndiaIndonesiaIran, Islamic Rep.IraqIrelandIsraelItalyJamaicaJapanJordanKazakhstanKenyaKorea, Dem. People’s Rep.Korea, Rep.KosovoKuwaitKyrgyz RepublicLate-demographic dividendLatin America & Caribbean Latin America & Caribbean (excluding high income)Latin America & the Caribbean (IDA & IBRD countries)LatviaLeast developed countries: UN classificationLebanonLibyaLithuaniaLow & middle incomeLow incomeLower middle incomeLuxembourgMacedonia, FYRMalaysiaMaltaMauritiusMexicoMiddle East & North AfricaMiddle East & North Africa (excluding high income)Middle East & North Africa (IDA & IBRD countries)Middle incomeMoldovaMongoliaMontenegroMoroccoMozambiqueMyanmarNamibiaNepalNetherlandsNew ZealandNicaraguaNigerNigeriaNorth AmericaNorwayOECD membersOmanOther small statesPakistanPanamaParaguayPeruPhilippinesPolandPortugalPost-demographic dividendPre-demographic dividendQatarRomaniaRussian FederationSaudi ArabiaSenegalSerbiaSingaporeSlovak RepublicSloveniaSmall statesSouth AfricaSouth AsiaSouth Asia (IDA & IBRD)South SudanSpainSri LankaSub-Saharan Africa Sub-Saharan Africa (excluding high income)Sub-Saharan Africa (IDA & IBRD countries)SudanSwedenSwitzerlandSyrian Arab RepublicTajikistanTanzaniaThailandTogoTrinidad and TobagoTunisiaTurkeyTurkmenistanUkraineUnited Arab EmiratesUnited KingdomUnited StatesUpper middle incomeUruguayUzbekistanVenezuela, RBVietnamWorldYemen, Rep.ZambiaZimbabwe Linea del tempo:
Questa scala temporale mostra un grafico dal 1972 anno al 2014 anno. Arab World. I dati fino ad 1971 anno non disponibili. Il numero di osservazioni attuali secondo i date: 43.
La fonte (nome):
Indicatori dello sviluppo mondiale
La fonte (organizzazione):
IEA Statistics © OECD/IEA 2014 (http://www.iea.org/stats/index.asp), subject to https://www.iea.org/t&c/termsandconditions/
Categorie:
Energy & Mining
sono stati aggiornati
23 apr 2017 anni
Indicatori delle variazioni dei valori per anni
Minima:
2.111
1 gen 2013 anni
Massimo:
15.058
1 gen 1972 anni
Alla data di osservazione
Valore
Variazione assoluta
La variazione rispetto al valore precedente
1 gen 1972 anni
15.058
+15.058
0.0%
1 gen 1973 anni
14.765
-0.292
-1.94%
1 gen 1974 anni
13.743
-1.022
-6.92%
1 gen 1975 anni
13.096
-0.647
-4.71%
1 gen 1976 anni
12.378
-0.719
-5.49%
1 gen 1977 anni
11.43
-0.948
-7.66%
1 gen 1978 anni
10.728
-0.702
-6.14%
1 gen 1979 anni
9.541
-1.187
-11.06%
1 gen 1980 anni
8.234
-1.308
-13.71%
1 gen 1981 anni
7.528
-0.705
-8.56%
1 gen 1982 anni
6.705
-0.824
-10.94%
1 gen 1983 anni
6.183
-0.522
-7.78%
1 gen 1984 anni
5.938
-0.245
-3.96%
1 gen 1985 anni
5.875
-0.063
-1.06%
1 gen 1986 anni
5.724
-0.151
-2.57%
1 gen 1987 anni
5.573
-0.152
-2.65%
1 gen 1988 anni
5.252
-0.32
-5.75%
1 gen 1989 anni
4.923
-0.33
-6.28%
1 gen 1990 anni
4.745
-0.177
-3.6%
1 gen 1991 anni
5.101
+0.356
7.49%
1 gen 1992 anni
5.034
-0.067
-1.32%
1 gen 1993 anni
4.627
-0.407
-8.08%
1 gen 1994 anni
4.408
-0.219
-4.74%
1 gen 1995 anni
4.585
+0.178
4.03%
1 gen 1996 anni
4.521
-0.064
-1.4%
1 gen 1997 anni
4.426
-0.095
-2.11%
1 gen 1998 anni
4.34
-0.085
-1.93%
1 gen 1999 anni
4.323
-0.018
-0.41%
1 gen 2000 anni
4.328
+0.005
0.11%
1 gen 2001 anni
4.246
-0.082
-1.9%
1 gen 2002 anni
4.22
-0.026
-0.61%
1 gen 2003 anni
4.149
-0.071
-1.68%
1 gen 2004 anni
4.029
-0.119
-2.88%
1 gen 2005 anni
3.758
-0.271
-6.73%
1 gen 2006 anni
3.519
-0.239
-6.36%
1 gen 2007 anni
3.364
-0.155
-4.39%
1 gen 2008 anni
3.054
-0.311
-9.24%
1 gen 2009 anni
2.829
-0.225
-7.36%
1 gen 2010 anni
2.746
-0.083
-2.94%
1 gen 2011 anni
2.595
-0.151
-5.49%
1 gen 2012 anni
2.626
+0.032
1.22%
1 gen 2013 anni
2.111
-0.516
-19.64%
1 gen 2014 anni
2.125
+0.015
0.7%
Classificazione dei paesi secondo i statistiche attuali per anni


Commenti: