29
/it/
it
AIzaSyAYiBZKx7MnpbEhh9jyipgxe19OcubqV5w
April 1, 2024
135317
Gabon
GAB
true
2
1
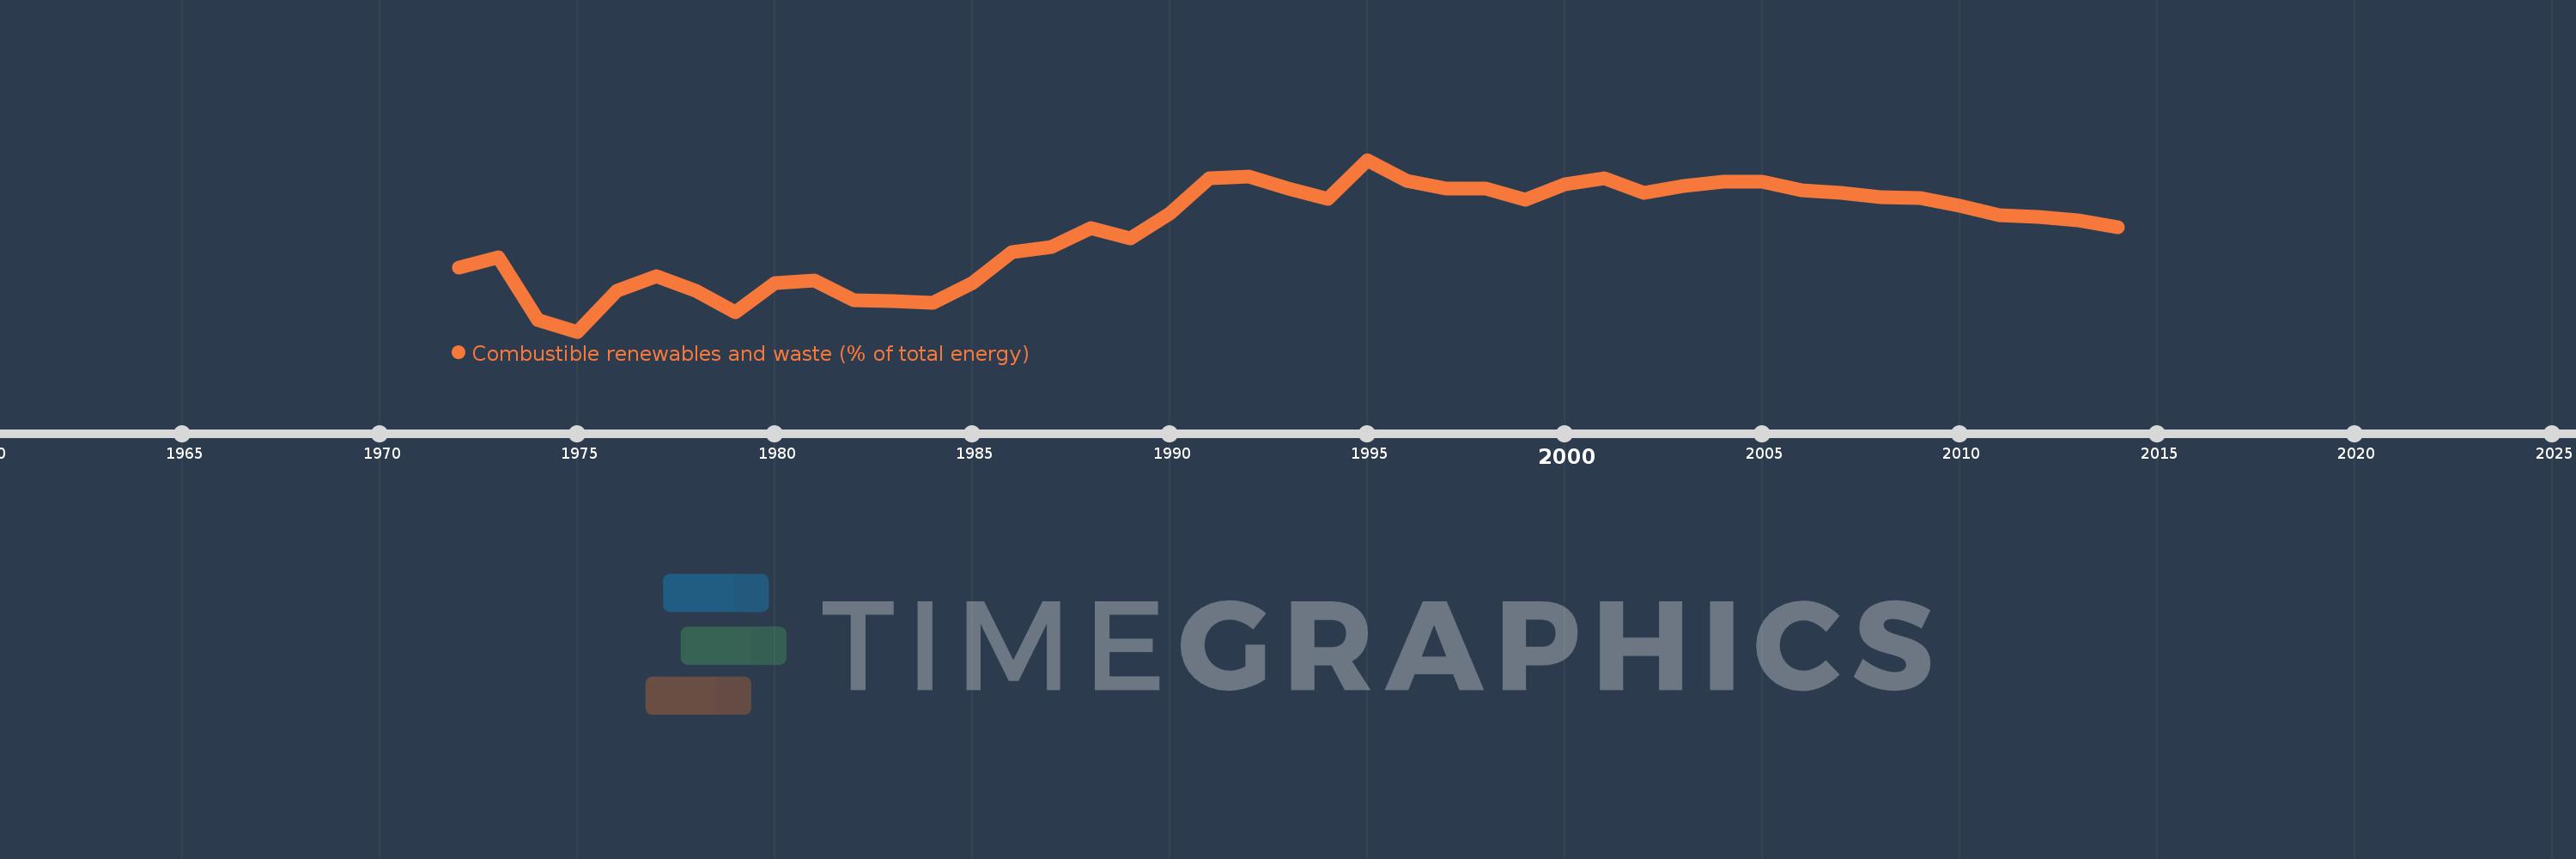
Combustible renewables and waste (% of total energy)
2014,2013,2012,2011,2010,2009,2008,2007,2006,2005,2004,2003,2002,2001,2000,1999,1998,1997,1996,1995,1994,1993,1992,1991,1990,1989,1988,1987,1986,1985,1984,1983,1982,1981,1980,1979,1978,1977,1976,1975,1974,1973,1972
Queste statistiche in altri paesi:
AlbaniaAlgeriaAngolaArab WorldArgentinaArmeniaAustraliaAustriaAzerbaijanBahrainBangladeshBelarusBelgiumBeninBoliviaBosnia and HerzegovinaBotswanaBrazilBrunei DarussalamBulgariaCambodiaCameroonCanadaCaribbean small statesCentral Europe and the BalticsChileChinaColombiaCongo, Dem. Rep.Congo, Rep.Costa RicaCote d'IvoireCroatiaCubaCuracaoCyprusCzech RepublicDenmarkDominican RepublicEarly-demographic dividendEast Asia & PacificEast Asia & Pacific (excluding high income)East Asia & Pacific (IDA & IBRD countries)EcuadorEgypt, Arab Rep.El SalvadorEritreaEstoniaEthiopiaEuro areaEurope & Central AsiaEurope & Central Asia (excluding high income)Europe & Central Asia (IDA & IBRD countries)European UnionFinlandFragile and conflict affected situationsFranceGabonGeorgiaGermanyGhanaGibraltarGreeceGuatemalaHaitiHeavily indebted poor countries (HIPC)High incomeHondurasHong Kong SAR, ChinaHungaryIBRD onlyIcelandIDA & IBRD totalIDA blendIDA onlyIDA totalIndiaIndonesiaIran, Islamic Rep.IraqIrelandIsraelItalyJamaicaJapanJordanKazakhstanKenyaKorea, Dem. People’s Rep.Korea, Rep.KosovoKuwaitKyrgyz RepublicLate-demographic dividendLatin America & Caribbean Latin America & Caribbean (excluding high income)Latin America & the Caribbean (IDA & IBRD countries)LatviaLeast developed countries: UN classificationLebanonLibyaLithuaniaLow & middle incomeLow incomeLower middle incomeLuxembourgMacedonia, FYRMalaysiaMaltaMauritiusMexicoMiddle East & North AfricaMiddle East & North Africa (excluding high income)Middle East & North Africa (IDA & IBRD countries)Middle incomeMoldovaMongoliaMontenegroMoroccoMozambiqueMyanmarNamibiaNepalNetherlandsNew ZealandNicaraguaNigerNigeriaNorth AmericaNorwayOECD membersOmanOther small statesPakistanPanamaParaguayPeruPhilippinesPolandPortugalPost-demographic dividendPre-demographic dividendQatarRomaniaRussian FederationSaudi ArabiaSenegalSerbiaSingaporeSlovak RepublicSloveniaSmall statesSouth AfricaSouth AsiaSouth Asia (IDA & IBRD)South SudanSpainSri LankaSub-Saharan Africa Sub-Saharan Africa (excluding high income)Sub-Saharan Africa (IDA & IBRD countries)SudanSwedenSwitzerlandSyrian Arab RepublicTajikistanTanzaniaThailandTogoTrinidad and TobagoTunisiaTurkeyTurkmenistanUkraineUnited Arab EmiratesUnited KingdomUnited StatesUpper middle incomeUruguayUzbekistanVenezuela, RBVietnamWorldYemen, Rep.ZambiaZimbabwe Linea del tempo:
Questa scala temporale mostra un grafico dal 1972 anno al 2014 anno. Gabon. I dati fino ad 1971 anno non disponibili. Il numero di osservazioni attuali secondo i date: 43.
La fonte (nome):
Indicatori dello sviluppo mondiale
La fonte (organizzazione):
IEA Statistics © OECD/IEA 2014 (http://www.iea.org/stats/index.asp), subject to https://www.iea.org/t&c/termsandconditions/
Categorie:
Energy & Mining
sono stati aggiornati
23 apr 2017 anni
Indicatori delle variazioni dei valori per anni
Minima:
33.026
1 gen 1975 anni
Massimo:
66.385
1 gen 1995 anni
Alla data di osservazione
Valore
Variazione assoluta
La variazione rispetto al valore precedente
1 gen 1972 anni
45.437
+45.437
0.0%
1 gen 1973 anni
47.445
+2.008
4.42%
1 gen 1974 anni
35.208
-12.237
-25.79%
1 gen 1975 anni
33.026
-2.182
-6.2%
1 gen 1976 anni
40.991
+7.965
24.12%
1 gen 1977 anni
43.728
+2.737
6.68%
1 gen 1978 anni
40.939
-2.79
-6.38%
1 gen 1979 anni
36.802
-4.137
-10.11%
1 gen 1980 anni
42.456
+5.655
15.37%
1 gen 1981 anni
43.025
+0.569
1.34%
1 gen 1982 anni
39.171
-3.854
-8.96%
1 gen 1983 anni
38.902
-0.269
-0.69%
1 gen 1984 anni
38.638
-0.263
-0.68%
1 gen 1985 anni
42.463
+3.824
9.9%
1 gen 1986 anni
48.508
+6.045
14.24%
1 gen 1987 anni
49.463
+0.955
1.97%
1 gen 1988 anni
53.092
+3.629
7.34%
1 gen 1989 anni
51.169
-1.923
-3.62%
1 gen 1990 anni
56.032
+4.863
9.5%
1 gen 1991 anni
62.857
+6.825
12.18%
1 gen 1992 anni
63.116
+0.259
0.41%
1 gen 1993 anni
60.825
-2.291
-3.63%
1 gen 1994 anni
58.817
-2.008
-3.3%
1 gen 1995 anni
66.385
+7.568
12.87%
1 gen 1996 anni
62.317
-4.067
-6.13%
1 gen 1997 anni
60.744
-1.573
-2.52%
1 gen 1998 anni
60.843
+0.099
0.16%
1 gen 1999 anni
58.578
-2.265
-3.72%
1 gen 2000 anni
61.564
+2.985
5.1%
1 gen 2001 anni
62.873
+1.31
2.13%
1 gen 2002 anni
60.035
-2.839
-4.51%
1 gen 2003 anni
61.229
+1.194
1.99%
1 gen 2004 anni
62.134
+0.905
1.48%
1 gen 2005 anni
62.061
-0.073
-0.12%
1 gen 2006 anni
60.431
-1.631
-2.63%
1 gen 2007 anni
59.94
-0.491
-0.81%
1 gen 2008 anni
59.169
-0.771
-1.29%
1 gen 2009 anni
58.925
-0.244
-0.41%
1 gen 2010 anni
57.449
-1.477
-2.51%
1 gen 2011 anni
55.598
-1.851
-3.22%
1 gen 2012 anni
55.298
-0.3
-0.54%
1 gen 2013 anni
54.547
-0.752
-1.36%
1 gen 2014 anni
53.317
-1.23
-2.25%
Classificazione dei paesi secondo i statistiche attuali per anni


Commenti: