29
/it/
it
AIzaSyAYiBZKx7MnpbEhh9jyipgxe19OcubqV5w
April 1, 2024
260640
Tanzania
TZA
true
2
1
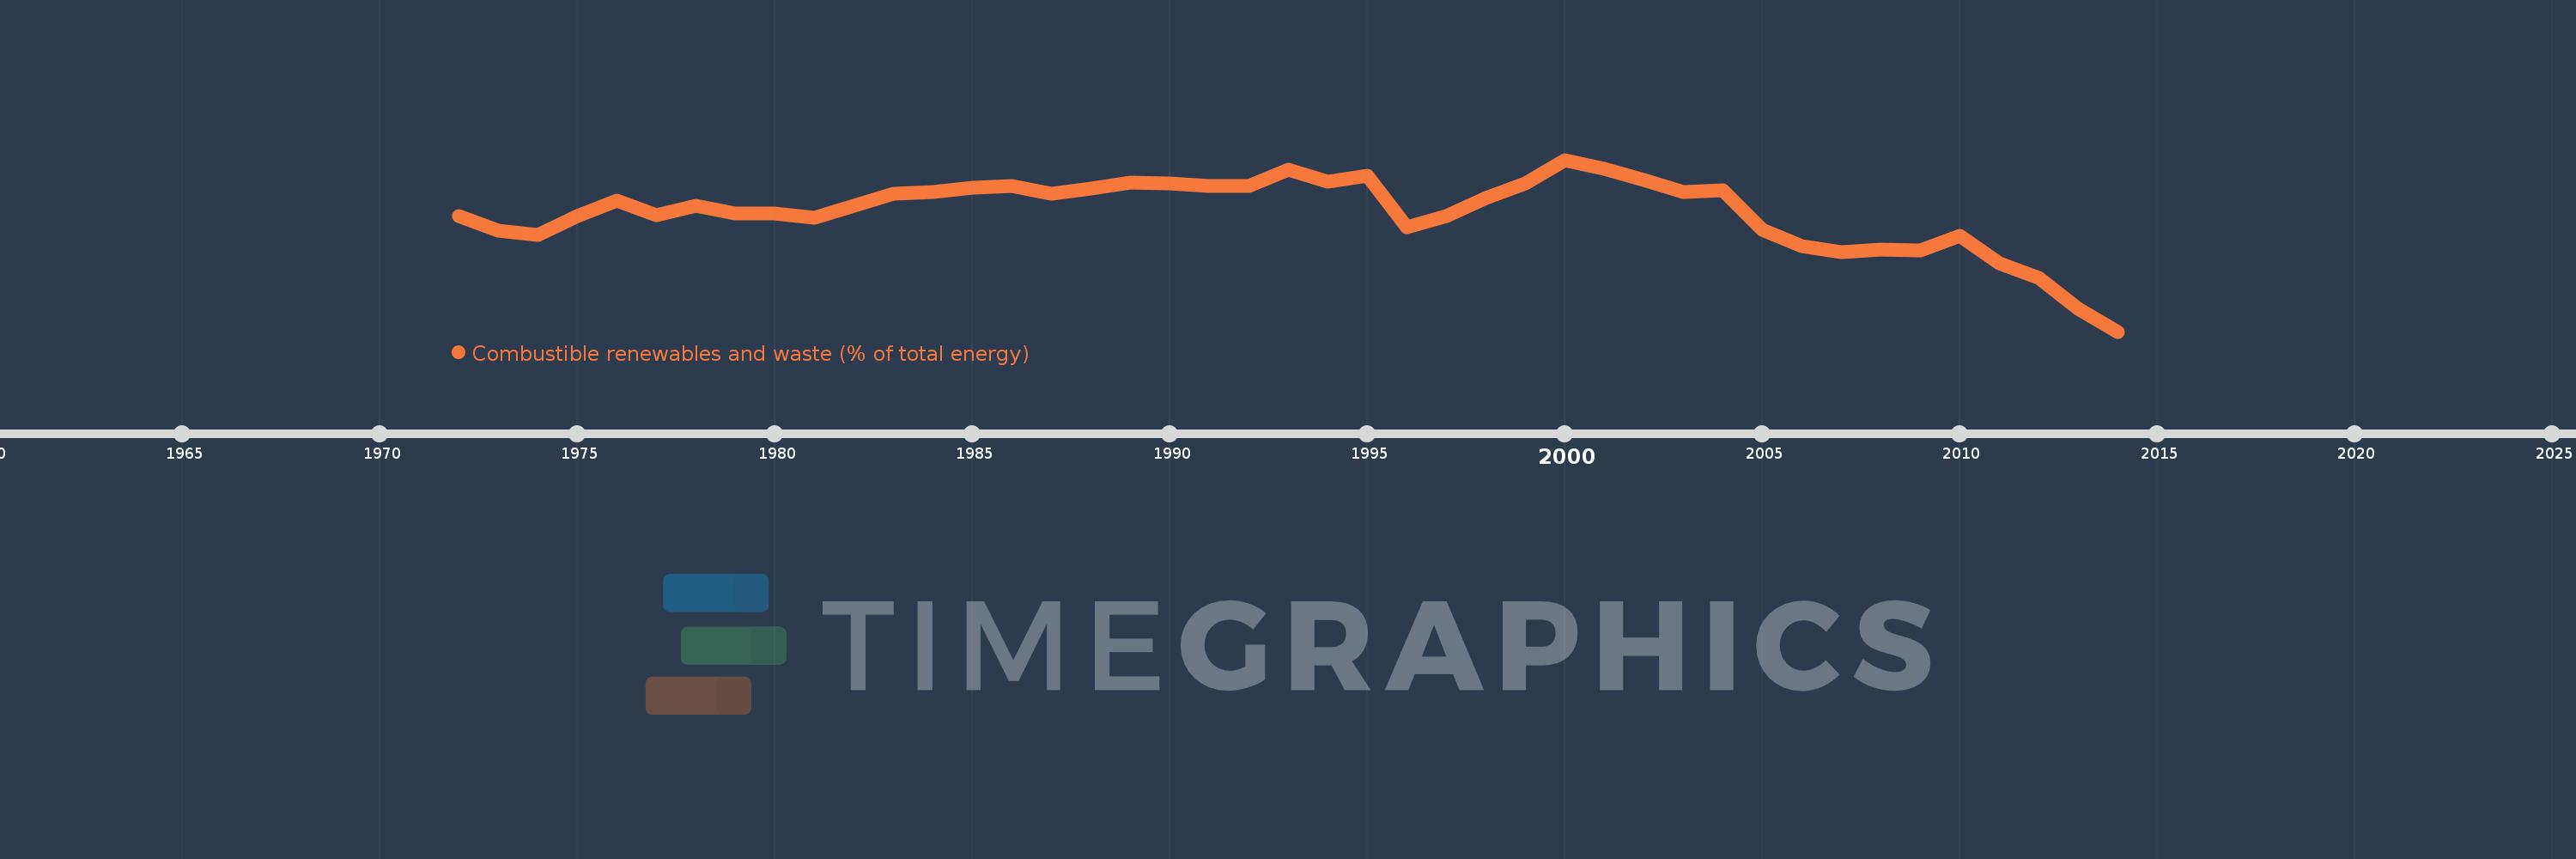
Combustible renewables and waste (% of total energy)
2014,2013,2012,2011,2010,2009,2008,2007,2006,2005,2004,2003,2002,2001,2000,1999,1998,1997,1996,1995,1994,1993,1992,1991,1990,1989,1988,1987,1986,1985,1984,1983,1982,1981,1980,1979,1978,1977,1976,1975,1974,1973,1972
Queste statistiche in altri paesi:
AlbaniaAlgeriaAngolaArab WorldArgentinaArmeniaAustraliaAustriaAzerbaijanBahrainBangladeshBelarusBelgiumBeninBoliviaBosnia and HerzegovinaBotswanaBrazilBrunei DarussalamBulgariaCambodiaCameroonCanadaCaribbean small statesCentral Europe and the BalticsChileChinaColombiaCongo, Dem. Rep.Congo, Rep.Costa RicaCote d'IvoireCroatiaCubaCuracaoCyprusCzech RepublicDenmarkDominican RepublicEarly-demographic dividendEast Asia & PacificEast Asia & Pacific (excluding high income)East Asia & Pacific (IDA & IBRD countries)EcuadorEgypt, Arab Rep.El SalvadorEritreaEstoniaEthiopiaEuro areaEurope & Central AsiaEurope & Central Asia (excluding high income)Europe & Central Asia (IDA & IBRD countries)European UnionFinlandFragile and conflict affected situationsFranceGabonGeorgiaGermanyGhanaGibraltarGreeceGuatemalaHaitiHeavily indebted poor countries (HIPC)High incomeHondurasHong Kong SAR, ChinaHungaryIBRD onlyIcelandIDA & IBRD totalIDA blendIDA onlyIDA totalIndiaIndonesiaIran, Islamic Rep.IraqIrelandIsraelItalyJamaicaJapanJordanKazakhstanKenyaKorea, Dem. People’s Rep.Korea, Rep.KosovoKuwaitKyrgyz RepublicLate-demographic dividendLatin America & Caribbean Latin America & Caribbean (excluding high income)Latin America & the Caribbean (IDA & IBRD countries)LatviaLeast developed countries: UN classificationLebanonLibyaLithuaniaLow & middle incomeLow incomeLower middle incomeLuxembourgMacedonia, FYRMalaysiaMaltaMauritiusMexicoMiddle East & North AfricaMiddle East & North Africa (excluding high income)Middle East & North Africa (IDA & IBRD countries)Middle incomeMoldovaMongoliaMontenegroMoroccoMozambiqueMyanmarNamibiaNepalNetherlandsNew ZealandNicaraguaNigerNigeriaNorth AmericaNorwayOECD membersOmanOther small statesPakistanPanamaParaguayPeruPhilippinesPolandPortugalPost-demographic dividendPre-demographic dividendQatarRomaniaRussian FederationSaudi ArabiaSenegalSerbiaSingaporeSlovak RepublicSloveniaSmall statesSouth AfricaSouth AsiaSouth Asia (IDA & IBRD)South SudanSpainSri LankaSub-Saharan Africa Sub-Saharan Africa (excluding high income)Sub-Saharan Africa (IDA & IBRD countries)SudanSwedenSwitzerlandSyrian Arab RepublicTajikistanTanzaniaThailandTogoTrinidad and TobagoTunisiaTurkeyTurkmenistanUkraineUnited Arab EmiratesUnited KingdomUnited StatesUpper middle incomeUruguayUzbekistanVenezuela, RBVietnamWorldYemen, Rep.ZambiaZimbabwe Linea del tempo:
Questa scala temporale mostra un grafico dal 1972 anno al 2014 anno. Tanzania. I dati fino ad 1971 anno non disponibili. Il numero di osservazioni attuali secondo i date: 43.
La fonte (nome):
Indicatori dello sviluppo mondiale
La fonte (organizzazione):
IEA Statistics © OECD/IEA 2014 (http://www.iea.org/stats/index.asp), subject to https://www.iea.org/t&c/termsandconditions/
Categorie:
Energy & Mining
sono stati aggiornati
23 apr 2017 anni
Indicatori delle variazioni dei valori per anni
Minima:
84.984
1 gen 2014 anni
Massimo:
92.965
1 gen 2000 anni
Alla data di osservazione
Valore
Variazione assoluta
La variazione rispetto al valore precedente
1 gen 1972 anni
90.355
+90.355
0.0%
1 gen 1973 anni
89.682
-0.673
-0.75%
1 gen 1974 anni
89.49
-0.192
-0.21%
1 gen 1975 anni
90.357
+0.867
0.97%
1 gen 1976 anni
91.075
+0.718
0.79%
1 gen 1977 anni
90.385
-0.69
-0.76%
1 gen 1978 anni
90.812
+0.428
0.47%
1 gen 1979 anni
90.461
-0.352
-0.39%
1 gen 1980 anni
90.461
+0.001
0.0%
1 gen 1981 anni
90.287
-0.175
-0.19%
1 gen 1982 anni
90.847
+0.561
0.62%
1 gen 1983 anni
91.392
+0.544
0.6%
1 gen 1984 anni
91.471
+0.08
0.09%
1 gen 1985 anni
91.67
+0.199
0.22%
1 gen 1986 anni
91.731
+0.061
0.07%
1 gen 1987 anni
91.4
-0.331
-0.36%
1 gen 1988 anni
91.635
+0.235
0.26%
1 gen 1989 anni
91.909
+0.274
0.3%
1 gen 1990 anni
91.855
-0.054
-0.06%
1 gen 1991 anni
91.728
-0.127
-0.14%
1 gen 1992 anni
91.753
+0.025
0.03%
1 gen 1993 anni
92.487
+0.734
0.8%
1 gen 1994 anni
91.944
-0.543
-0.59%
1 gen 1995 anni
92.209
+0.264
0.29%
1 gen 1996 anni
89.837
-2.372
-2.57%
1 gen 1997 anni
90.337
+0.5
0.56%
1 gen 1998 anni
91.175
+0.838
0.93%
1 gen 1999 anni
91.886
+0.711
0.78%
1 gen 2000 anni
92.965
+1.079
1.17%
1 gen 2001 anni
92.544
-0.421
-0.45%
1 gen 2002 anni
92.04
-0.504
-0.54%
1 gen 2003 anni
91.47
-0.57
-0.62%
1 gen 2004 anni
91.551
+0.081
0.09%
1 gen 2005 anni
89.717
-1.833
-2.0%
1 gen 2006 anni
88.965
-0.752
-0.84%
1 gen 2007 anni
88.676
-0.289
-0.33%
1 gen 2008 anni
88.814
+0.138
0.16%
1 gen 2009 anni
88.756
-0.058
-0.07%
1 gen 2010 anni
89.445
+0.689
0.78%
1 gen 2011 anni
88.147
-1.298
-1.45%
1 gen 2012 anni
87.492
-0.656
-0.74%
1 gen 2013 anni
86.052
-1.44
-1.65%
1 gen 2014 anni
84.984
-1.068
-1.24%
Classificazione dei paesi secondo i statistiche attuali per anni


Commenti: