29
/it/
it
AIzaSyAYiBZKx7MnpbEhh9jyipgxe19OcubqV5w
April 1, 2024
51919
North America
NAC
false
2
1
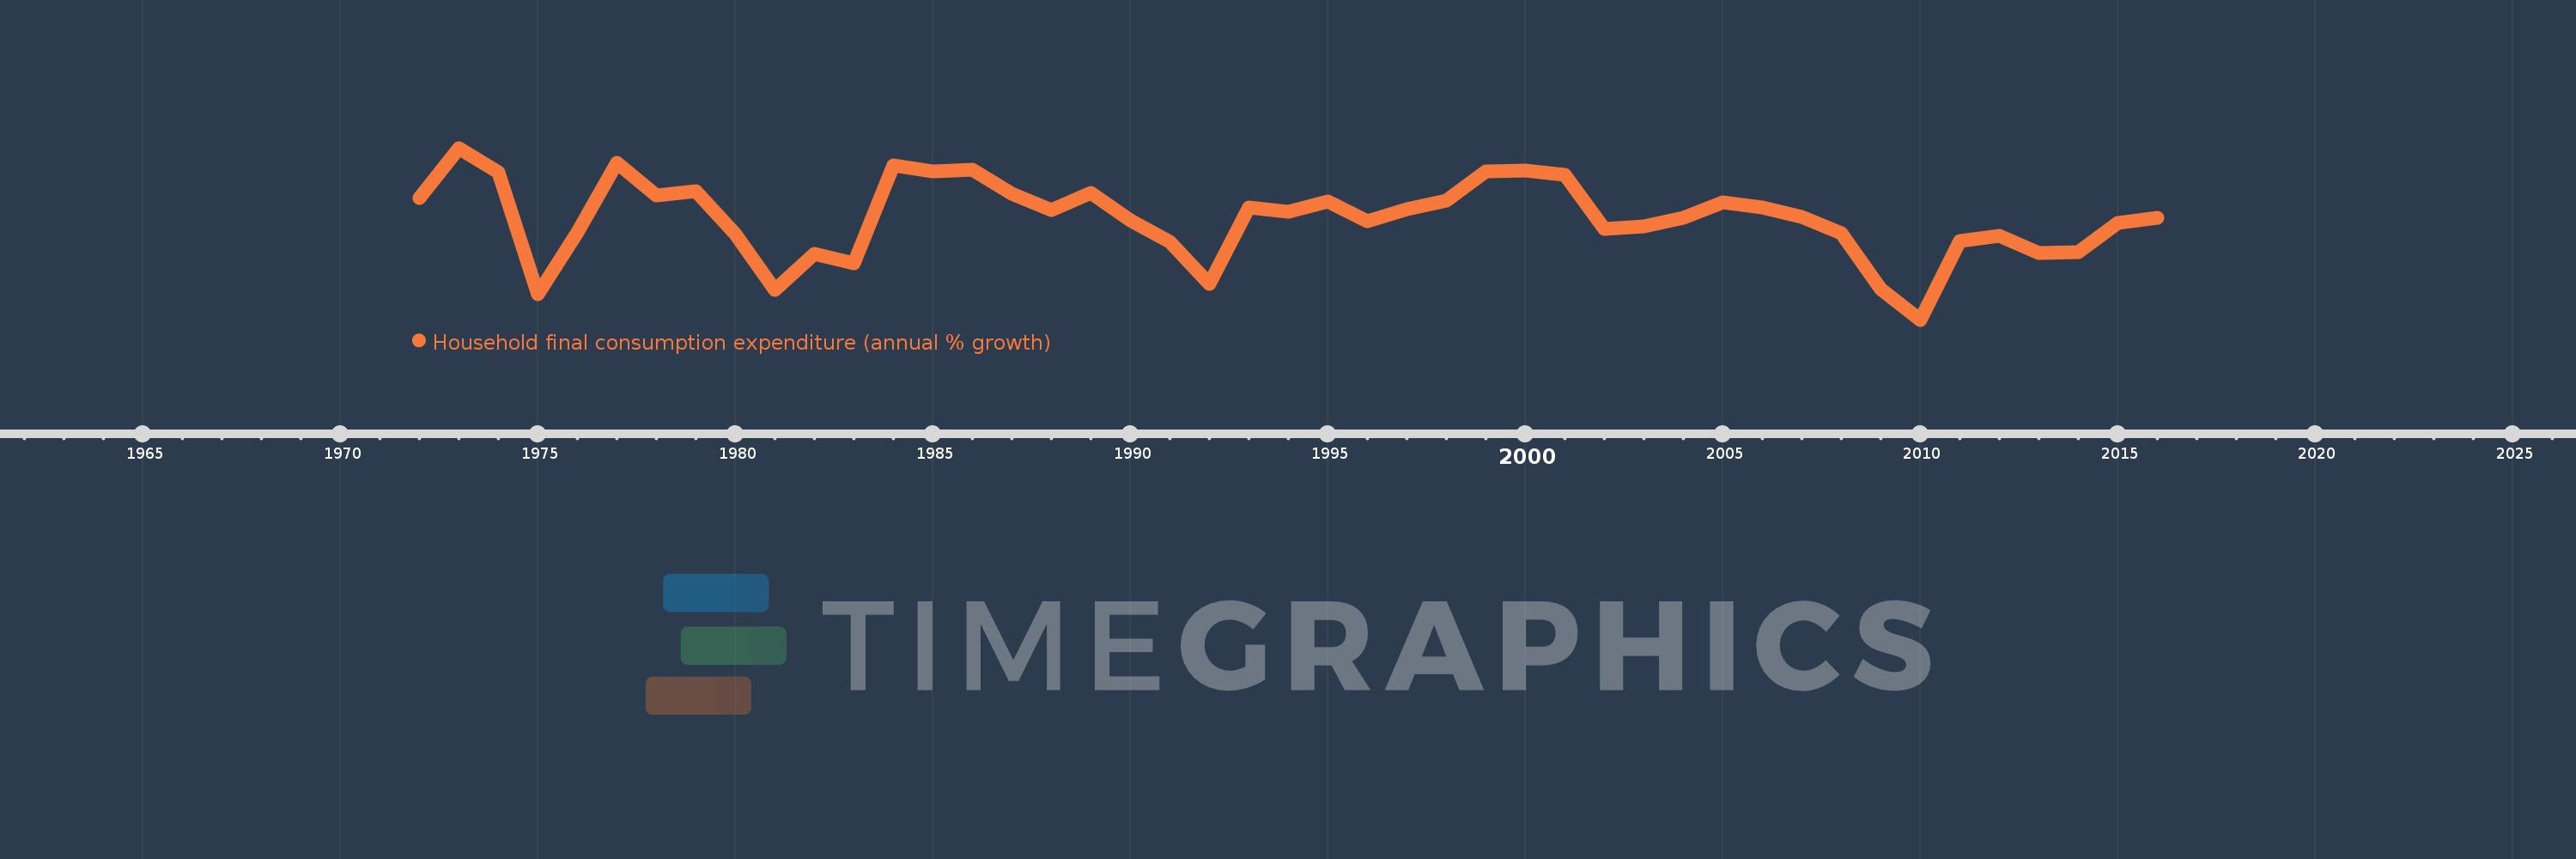
Household final consumption expenditure (annual % growth)
2016,2015,2014,2013,2012,2011,2010,2009,2008,2007,2006,2005,2004,2003,2002,2001,2000,1999,1998,1997,1996,1995,1994,1993,1992,1991,1990,1989,1988,1987,1986,1985,1984,1983,1982,1981,1980,1979,1978,1977,1976,1975,1974,1973,1972
Queste statistiche in altri paesi:
AlbaniaAlgeriaAntigua and BarbudaArab WorldArgentinaArmeniaAustraliaAustriaAzerbaijanBahamas, TheBahrainBangladeshBarbadosBelarusBelgiumBelizeBeninBhutanBoliviaBosnia and HerzegovinaBotswanaBrazilBrunei DarussalamBulgariaBurkina FasoBurundiCabo VerdeCambodiaCameroonCanadaCaribbean small statesCentral Europe and the BalticsChadChileChinaColombiaComorosCongo, Dem. Rep.Congo, Rep.Costa RicaCote d'IvoireCroatiaCubaCyprusCzech RepublicDenmarkDominican RepublicEarly-demographic dividendEast Asia & PacificEast Asia & Pacific (excluding high income)East Asia & Pacific (IDA & IBRD countries)EcuadorEgypt, Arab Rep.El SalvadorEquatorial GuineaEritreaEstoniaEthiopiaEuro areaEurope & Central AsiaEurope & Central Asia (excluding high income)Europe & Central Asia (IDA & IBRD countries)European UnionFinlandFranceGabonGambia, TheGeorgiaGermanyGhanaGreeceGuatemalaGuineaGuinea-BissauHaitiHeavily indebted poor countries (HIPC)High incomeHondurasHong Kong SAR, ChinaHungaryIBRD onlyIcelandIDA & IBRD totalIDA blendIDA onlyIDA totalIndiaIndonesiaIran, Islamic Rep.IrelandIsraelItalyJamaicaJapanJordanKazakhstanKenyaKorea, Rep.KosovoKuwaitKyrgyz RepublicLao PDRLate-demographic dividendLatin America & Caribbean Latin America & Caribbean (excluding high income)Latin America & the Caribbean (IDA & IBRD countries)LatviaLeast developed countries: UN classificationLebanonLiberiaLithuaniaLow & middle incomeLow incomeLower middle incomeLuxembourgMacao SAR, ChinaMacedonia, FYRMadagascarMalawiMalaysiaMaliMaltaMauritaniaMauritiusMexicoMiddle East & North AfricaMiddle East & North Africa (excluding high income)Middle East & North Africa (IDA & IBRD countries)Middle incomeMoldovaMongoliaMontenegroMoroccoMozambiqueNamibiaNepalNetherlandsNew ZealandNicaraguaNigerNigeriaNorth AmericaNorwayOECD membersOmanOther small statesPakistanPanamaPapua New GuineaParaguayPeruPhilippinesPolandPortugalPost-demographic dividendPre-demographic dividendPuerto RicoQatarRomaniaRussian FederationRwandaSaudi ArabiaSenegalSerbiaSeychellesSierra LeoneSingaporeSlovak RepublicSloveniaSmall statesSomaliaSouth AfricaSouth AsiaSouth Asia (IDA & IBRD)South SudanSpainSri LankaSub-Saharan Africa Sub-Saharan Africa (excluding high income)Sub-Saharan Africa (IDA & IBRD countries)SudanSurinameSwazilandSwedenSwitzerlandSyrian Arab RepublicTajikistanTanzaniaThailandTimor-LesteTogoTrinidad and TobagoTunisiaTurkeyTurkmenistanUgandaUkraineUnited Arab EmiratesUnited KingdomUnited StatesUpper middle incomeUruguayVanuatuVenezuela, RBVietnamWest Bank and GazaWorldZimbabwe Linea del tempo:
Questa scala temporale mostra un grafico dal 1972 anno al 2016 anno. North America. I dati fino ad 1971 anno non disponibili. Il numero di osservazioni attuali secondo i date: 45.
La fonte (nome):
Indicatori dello sviluppo mondiale
La fonte (organizzazione):
World Bank national accounts data, and OECD National Accounts data files.
Categorie:
Economy & Growth
sono stati aggiornati
23 apr 2017 anni
Indicatori delle variazioni dei valori per anni
Minima:
-1.47
1 gen 2010 anni
Massimo:
6.194
1 gen 1973 anni
Alla data di osservazione
Valore
Variazione assoluta
La variazione rispetto al valore precedente
1 gen 1972 anni
3.978
+3.978
0.0%
1 gen 1973 anni
6.194
+2.216
55.71%
1 gen 1974 anni
5.107
-1.087
-17.54%
1 gen 1975 anni
-0.325
-5.433
-106.36%
1 gen 1976 anni
2.41
+2.735
-841.3%
1 gen 1977 anni
5.536
+3.126
129.73%
1 gen 1978 anni
4.082
-1.454
-26.26%
1 gen 1979 anni
4.27
+0.188
4.59%
1 gen 1980 anni
2.367
-1.903
-44.56%
1 gen 1981 anni
-0.136
-2.503
-105.72%
1 gen 1982 anni
1.459
+1.595
-1.18 Mille.%
1 gen 1983 anni
1.058
-0.401
-27.51%
1 gen 1984 anni
5.424
+4.366
412.75%
1 gen 1985 anni
5.154
-0.27
-4.97%
1 gen 1986 anni
5.232
+0.079
1.53%
1 gen 1987 anni
4.139
-1.093
-20.9%
1 gen 1988 anni
3.429
-0.71
-17.16%
1 gen 1989 anni
4.183
+0.754
21.99%
1 gen 1990 anni
2.963
-1.22
-29.17%
1 gen 1991 anni
2.005
-0.958
-32.34%
1 gen 1992 anni
0.115
-1.889
-94.25%
1 gen 1993 anni
3.531
+3.416
2.96 Mille.%
1 gen 1994 anni
3.342
-0.189
-5.34%
1 gen 1995 anni
3.799
+0.457
13.68%
1 gen 1996 anni
2.932
-0.868
-22.84%
1 gen 1997 anni
3.452
+0.52
17.73%
1 gen 1998 anni
3.852
+0.401
11.6%
1 gen 1999 anni
5.143
+1.291
33.5%
1 gen 2000 anni
5.193
+0.05
0.98%
1 gen 2001 anni
5.0
-0.193
-3.72%
1 gen 2002 anni
2.583
-2.417
-48.34%
1 gen 2003 anni
2.684
+0.102
3.94%
1 gen 2004 anni
3.097
+0.413
15.39%
1 gen 2005 anni
3.78
+0.683
22.05%
1 gen 2006 anni
3.546
-0.235
-6.2%
1 gen 2007 anni
3.127
-0.419
-11.82%
1 gen 2008 anni
2.402
-0.724
-23.16%
1 gen 2009 anni
-0.085
-2.488
-103.56%
1 gen 2010 anni
-1.47
-1.385
1.62 Mille.%
1 gen 2011 anni
2.057
+3.527
-239.92%
1 gen 2012 anni
2.265
+0.208
10.13%
1 gen 2013 anni
1.497
-0.768
-33.92%
1 gen 2014 anni
1.539
+0.042
2.79%
1 gen 2015 anni
2.844
+1.305
84.8%
1 gen 2016 anni
3.074
+0.23
8.09%
Classificazione dei paesi secondo i statistiche attuali per anni


Commenti: