29
/it/
it
AIzaSyAYiBZKx7MnpbEhh9jyipgxe19OcubqV5w
April 1, 2024
104965
Chile
CHL
true
2
1
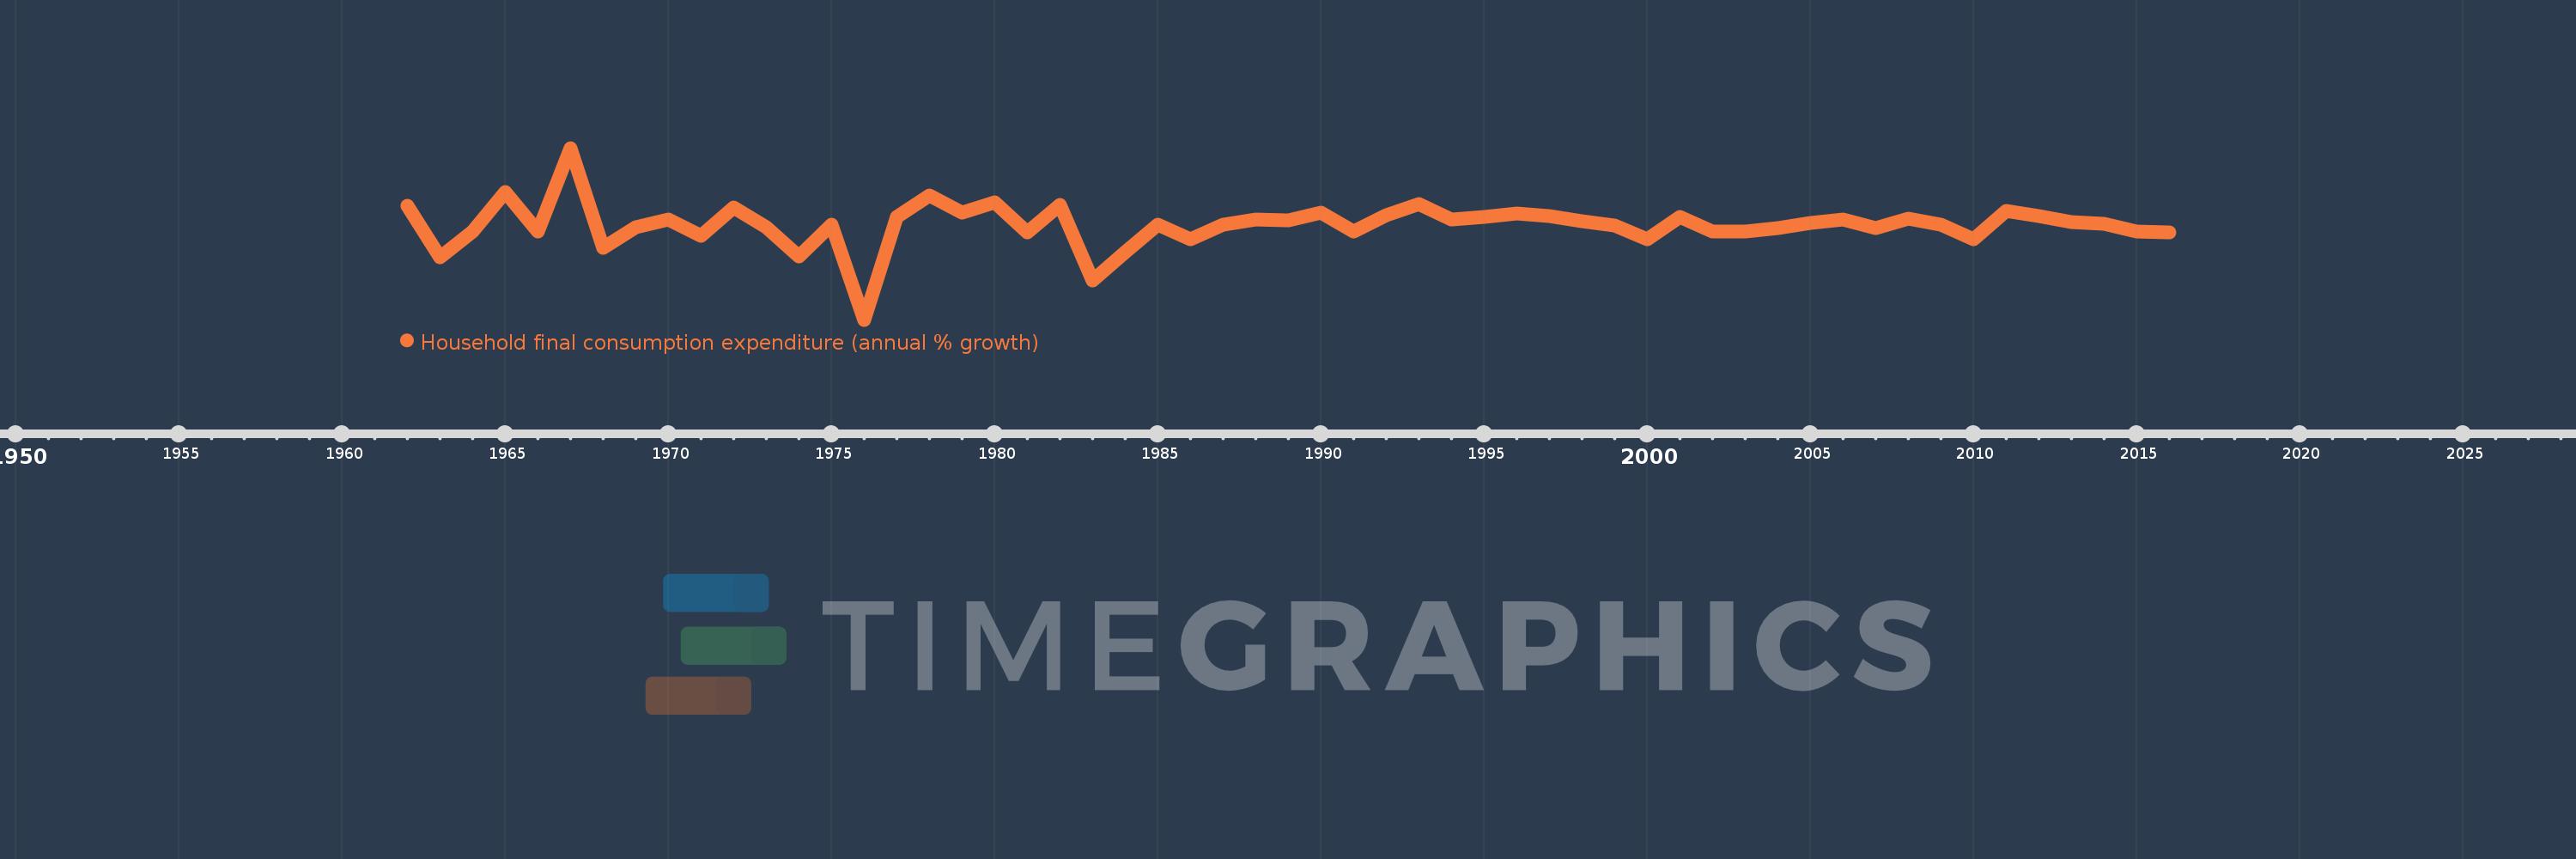
Household final consumption expenditure (annual % growth)
2016,2015,2014,2013,2012,2011,2010,2009,2008,2007,2006,2005,2004,2003,2002,2001,2000,1999,1998,1997,1996,1995,1994,1993,1992,1991,1990,1989,1988,1987,1986,1985,1984,1983,1982,1981,1980,1979,1978,1977,1976,1975,1974,1973,1972,1971,1970,1969,1968,1967,1966,1965,1964,1963,1962
Queste statistiche in altri paesi:
AlbaniaAlgeriaAntigua and BarbudaArab WorldArgentinaArmeniaAustraliaAustriaAzerbaijanBahamas, TheBahrainBangladeshBarbadosBelarusBelgiumBelizeBeninBhutanBoliviaBosnia and HerzegovinaBotswanaBrazilBrunei DarussalamBulgariaBurkina FasoBurundiCabo VerdeCambodiaCameroonCanadaCaribbean small statesCentral Europe and the BalticsChadChileChinaColombiaComorosCongo, Dem. Rep.Congo, Rep.Costa RicaCote d'IvoireCroatiaCubaCyprusCzech RepublicDenmarkDominican RepublicEarly-demographic dividendEast Asia & PacificEast Asia & Pacific (excluding high income)East Asia & Pacific (IDA & IBRD countries)EcuadorEgypt, Arab Rep.El SalvadorEquatorial GuineaEritreaEstoniaEthiopiaEuro areaEurope & Central AsiaEurope & Central Asia (excluding high income)Europe & Central Asia (IDA & IBRD countries)European UnionFinlandFranceGabonGambia, TheGeorgiaGermanyGhanaGreeceGuatemalaGuineaGuinea-BissauHaitiHeavily indebted poor countries (HIPC)High incomeHondurasHong Kong SAR, ChinaHungaryIBRD onlyIcelandIDA & IBRD totalIDA blendIDA onlyIDA totalIndiaIndonesiaIran, Islamic Rep.IrelandIsraelItalyJamaicaJapanJordanKazakhstanKenyaKorea, Rep.KosovoKuwaitKyrgyz RepublicLao PDRLate-demographic dividendLatin America & Caribbean Latin America & Caribbean (excluding high income)Latin America & the Caribbean (IDA & IBRD countries)LatviaLeast developed countries: UN classificationLebanonLiberiaLithuaniaLow & middle incomeLow incomeLower middle incomeLuxembourgMacao SAR, ChinaMacedonia, FYRMadagascarMalawiMalaysiaMaliMaltaMauritaniaMauritiusMexicoMiddle East & North AfricaMiddle East & North Africa (excluding high income)Middle East & North Africa (IDA & IBRD countries)Middle incomeMoldovaMongoliaMontenegroMoroccoMozambiqueNamibiaNepalNetherlandsNew ZealandNicaraguaNigerNigeriaNorth AmericaNorwayOECD membersOmanOther small statesPakistanPanamaPapua New GuineaParaguayPeruPhilippinesPolandPortugalPost-demographic dividendPre-demographic dividendPuerto RicoQatarRomaniaRussian FederationRwandaSaudi ArabiaSenegalSerbiaSeychellesSierra LeoneSingaporeSlovak RepublicSloveniaSmall statesSomaliaSouth AfricaSouth AsiaSouth Asia (IDA & IBRD)South SudanSpainSri LankaSub-Saharan Africa Sub-Saharan Africa (excluding high income)Sub-Saharan Africa (IDA & IBRD countries)SudanSurinameSwazilandSwedenSwitzerlandSyrian Arab RepublicTajikistanTanzaniaThailandTimor-LesteTogoTrinidad and TobagoTunisiaTurkeyTurkmenistanUgandaUkraineUnited Arab EmiratesUnited KingdomUnited StatesUpper middle incomeUruguayVanuatuVenezuela, RBVietnamWest Bank and GazaWorldZimbabwe Linea del tempo:
Questa scala temporale mostra un grafico dal 1962 anno al 2016 anno. Chile. I dati fino ad 1961 anno non disponibili. Il numero di osservazioni attuali secondo i date: 55.
La fonte (nome):
Indicatori dello sviluppo mondiale
La fonte (organizzazione):
World Bank national accounts data, and OECD National Accounts data files.
Categorie:
Economy & Growth
sono stati aggiornati
23 apr 2017 anni
Indicatori delle variazioni dei valori per anni
Minima:
-34.094
1 gen 1976 anni
Massimo:
36.798
1 gen 1967 anni
Alla data di osservazione
Valore
Variazione assoluta
La variazione rispetto al valore precedente
1 gen 1962 anni
12.992
+12.992
0.0%
1 gen 1963 anni
-8.466
-21.458
-165.16%
1 gen 1964 anni
2.361
+10.827
-127.89%
1 gen 1965 anni
18.59
+16.229
687.3%
1 gen 1966 anni
2.212
-16.378
-88.1%
1 gen 1967 anni
36.798
+34.587
1.56 Mille.%
1 gen 1968 anni
-4.456
-41.255
-112.11%
1 gen 1969 anni
4.102
+8.558
-192.05%
1 gen 1970 anni
7.15
+3.048
74.31%
1 gen 1971 anni
0.493
-6.657
-93.1%
1 gen 1972 anni
12.408
+11.915
2.42 Mille.%
1 gen 1973 anni
4.035
-8.373
-67.48%
1 gen 1974 anni
-8.041
-12.075
-299.29%
1 gen 1975 anni
5.048
+13.088
-162.78%
1 gen 1976 anni
-34.094
-39.142
-775.46%
1 gen 1977 anni
8.485
+42.579
-124.89%
1 gen 1978 anni
17.187
+8.703
102.57%
1 gen 1979 anni
9.935
-7.253
-42.2%
1 gen 1980 anni
14.52
+4.585
46.15%
1 gen 1981 anni
1.781
-12.739
-87.74%
1 gen 1982 anni
13.389
+11.608
651.87%
1 gen 1983 anni
-17.947
-31.336
-234.04%
1 gen 1984 anni
-6.28
+11.666
-65.01%
1 gen 1985 anni
5.159
+11.439
-182.14%
1 gen 1986 anni
-0.981
-6.14
-119.02%
1 gen 1987 anni
5.118
+6.099
-621.75%
1 gen 1988 anni
7.228
+2.11
41.22%
1 gen 1989 anni
7.029
-0.199
-2.76%
1 gen 1990 anni
10.146
+3.117
44.35%
1 gen 1991 anni
2.192
-7.954
-78.4%
1 gen 1992 anni
8.87
+6.678
304.67%
1 gen 1993 anni
13.79
+4.92
55.47%
1 gen 1994 anni
7.428
-6.362
-46.13%
1 gen 1995 anni
8.176
+0.748
10.07%
1 gen 1996 anni
9.817
+1.64
20.06%
1 gen 1997 anni
8.753
-1.063
-10.83%
1 gen 1998 anni
6.591
-2.162
-24.7%
1 gen 1999 anni
4.671
-1.92
-29.13%
1 gen 2000 anni
-0.952
-5.624
-120.39%
1 gen 2001 anni
8.511
+9.464
-993.66%
1 gen 2002 anni
2.465
-6.047
-71.04%
1 gen 2003 anni
2.353
-0.112
-4.55%
1 gen 2004 anni
3.625
+1.272
54.08%
1 gen 2005 anni
5.857
+2.233
61.59%
1 gen 2006 anni
7.111
+1.254
21.41%
1 gen 2007 anni
3.679
-3.433
-48.27%
1 gen 2008 anni
7.648
+3.97
107.91%
1 gen 2009 anni
5.18
-2.469
-32.28%
1 gen 2010 anni
-0.786
-5.966
-115.17%
1 gen 2011 anni
10.824
+11.61
-1.48 Mille.%
1 gen 2012 anni
8.852
-1.972
-18.22%
1 gen 2013 anni
6.069
-2.783
-31.44%
1 gen 2014 anni
5.471
-0.598
-9.86%
1 gen 2015 anni
2.375
-3.096
-56.59%
1 gen 2016 anni
1.89
-0.484
-20.4%
Classificazione dei paesi secondo i statistiche attuali per anni


Commenti: