29
/it/
it
AIzaSyAYiBZKx7MnpbEhh9jyipgxe19OcubqV5w
April 1, 2024
201664
Morocco
MAR
true
2
1
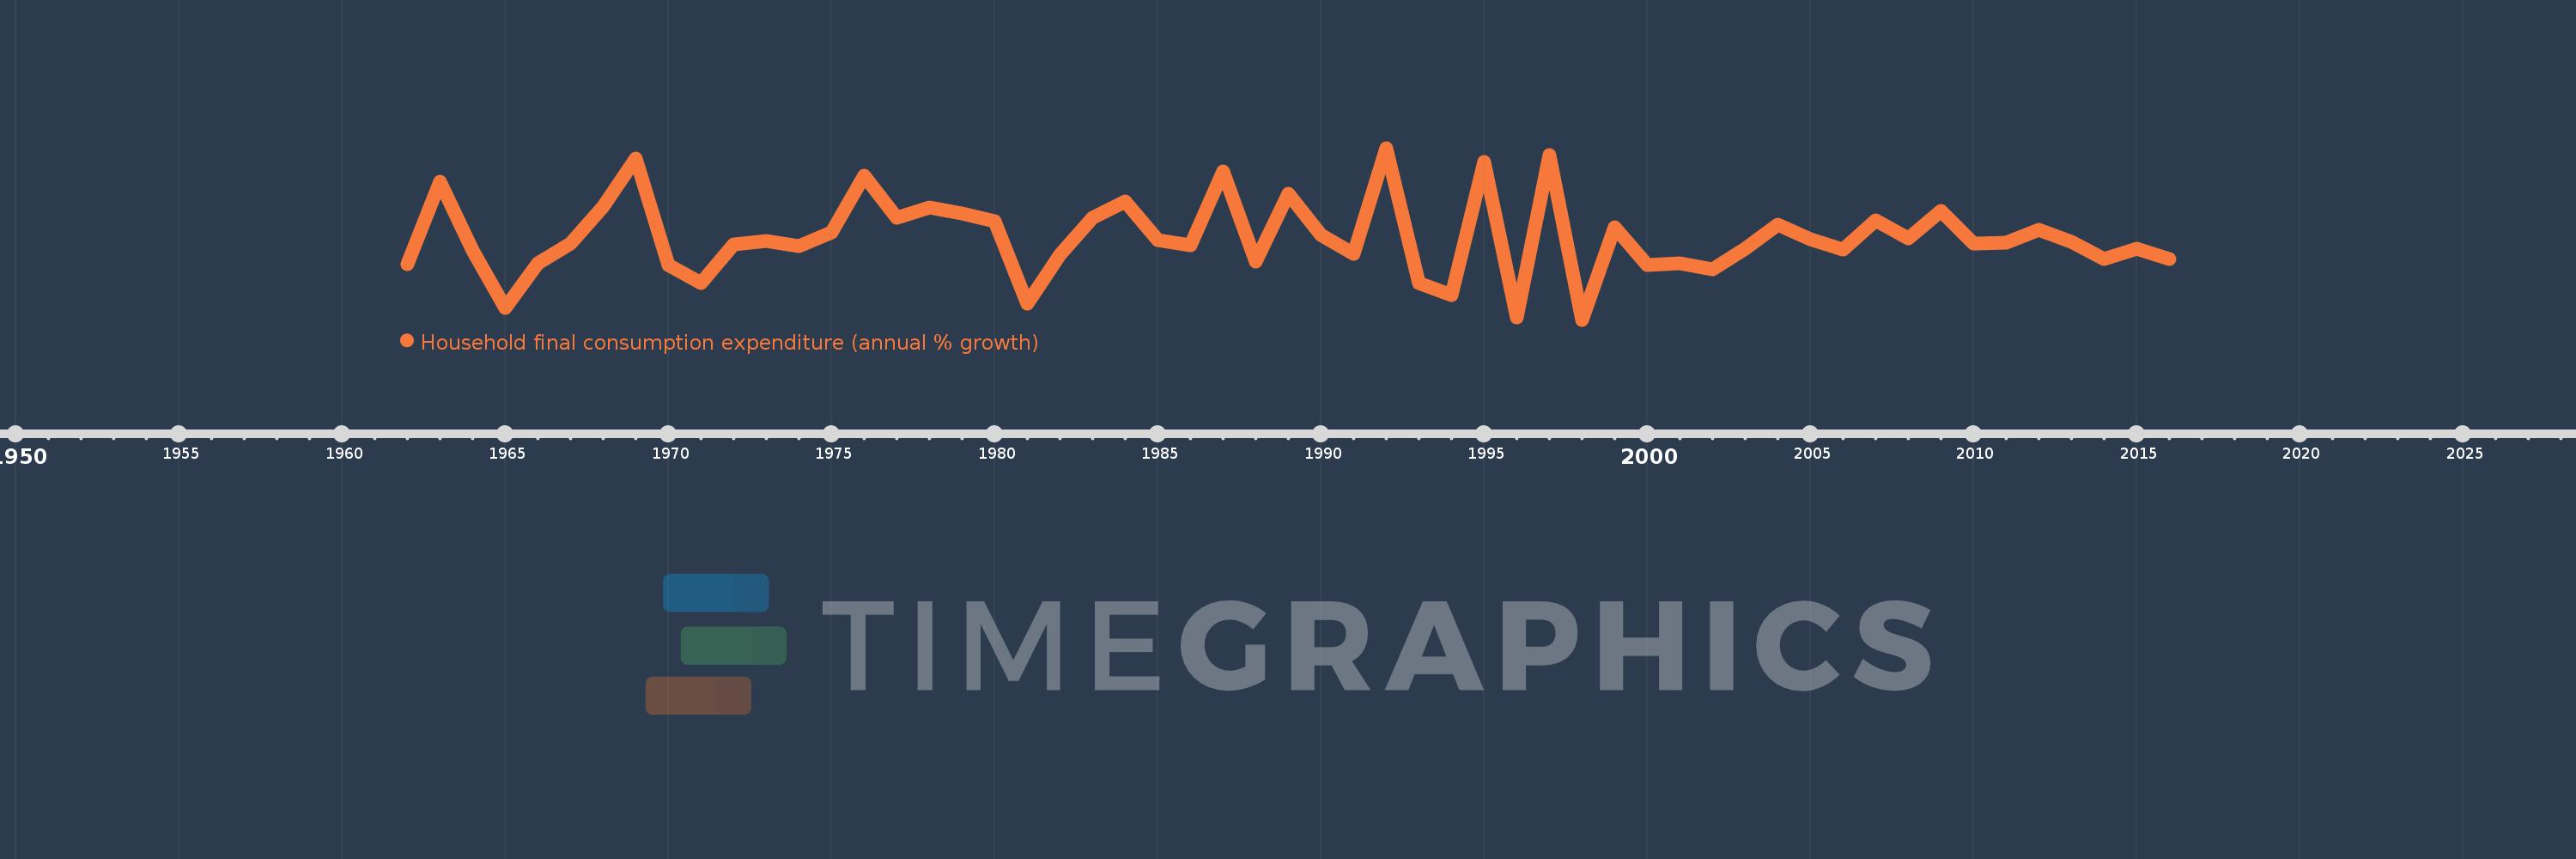
Household final consumption expenditure (annual % growth)
2016,2015,2014,2013,2012,2011,2010,2009,2008,2007,2006,2005,2004,2003,2002,2001,2000,1999,1998,1997,1996,1995,1994,1993,1992,1991,1990,1989,1988,1987,1986,1985,1984,1983,1982,1981,1980,1979,1978,1977,1976,1975,1974,1973,1972,1971,1970,1969,1968,1967,1966,1965,1964,1963,1962
Queste statistiche in altri paesi:
AlbaniaAlgeriaAntigua and BarbudaArab WorldArgentinaArmeniaAustraliaAustriaAzerbaijanBahamas, TheBahrainBangladeshBarbadosBelarusBelgiumBelizeBeninBhutanBoliviaBosnia and HerzegovinaBotswanaBrazilBrunei DarussalamBulgariaBurkina FasoBurundiCabo VerdeCambodiaCameroonCanadaCaribbean small statesCentral Europe and the BalticsChadChileChinaColombiaComorosCongo, Dem. Rep.Congo, Rep.Costa RicaCote d'IvoireCroatiaCubaCyprusCzech RepublicDenmarkDominican RepublicEarly-demographic dividendEast Asia & PacificEast Asia & Pacific (excluding high income)East Asia & Pacific (IDA & IBRD countries)EcuadorEgypt, Arab Rep.El SalvadorEquatorial GuineaEritreaEstoniaEthiopiaEuro areaEurope & Central AsiaEurope & Central Asia (excluding high income)Europe & Central Asia (IDA & IBRD countries)European UnionFinlandFranceGabonGambia, TheGeorgiaGermanyGhanaGreeceGuatemalaGuineaGuinea-BissauHaitiHeavily indebted poor countries (HIPC)High incomeHondurasHong Kong SAR, ChinaHungaryIBRD onlyIcelandIDA & IBRD totalIDA blendIDA onlyIDA totalIndiaIndonesiaIran, Islamic Rep.IrelandIsraelItalyJamaicaJapanJordanKazakhstanKenyaKorea, Rep.KosovoKuwaitKyrgyz RepublicLao PDRLate-demographic dividendLatin America & Caribbean Latin America & Caribbean (excluding high income)Latin America & the Caribbean (IDA & IBRD countries)LatviaLeast developed countries: UN classificationLebanonLiberiaLithuaniaLow & middle incomeLow incomeLower middle incomeLuxembourgMacao SAR, ChinaMacedonia, FYRMadagascarMalawiMalaysiaMaliMaltaMauritaniaMauritiusMexicoMiddle East & North AfricaMiddle East & North Africa (excluding high income)Middle East & North Africa (IDA & IBRD countries)Middle incomeMoldovaMongoliaMontenegroMoroccoMozambiqueNamibiaNepalNetherlandsNew ZealandNicaraguaNigerNigeriaNorth AmericaNorwayOECD membersOmanOther small statesPakistanPanamaPapua New GuineaParaguayPeruPhilippinesPolandPortugalPost-demographic dividendPre-demographic dividendPuerto RicoQatarRomaniaRussian FederationRwandaSaudi ArabiaSenegalSerbiaSeychellesSierra LeoneSingaporeSlovak RepublicSloveniaSmall statesSomaliaSouth AfricaSouth AsiaSouth Asia (IDA & IBRD)South SudanSpainSri LankaSub-Saharan Africa Sub-Saharan Africa (excluding high income)Sub-Saharan Africa (IDA & IBRD countries)SudanSurinameSwazilandSwedenSwitzerlandSyrian Arab RepublicTajikistanTanzaniaThailandTimor-LesteTogoTrinidad and TobagoTunisiaTurkeyTurkmenistanUgandaUkraineUnited Arab EmiratesUnited KingdomUnited StatesUpper middle incomeUruguayVanuatuVenezuela, RBVietnamWest Bank and GazaWorldZimbabwe Linea del tempo:
Questa scala temporale mostra un grafico dal 1962 anno al 2016 anno. Morocco. I dati fino ad 1961 anno non disponibili. Il numero di osservazioni attuali secondo i date: 55.
La fonte (nome):
Indicatori dello sviluppo mondiale
La fonte (organizzazione):
World Bank national accounts data, and OECD National Accounts data files.
Categorie:
Economy & Growth
sono stati aggiornati
23 apr 2017 anni
Indicatori delle variazioni dei valori per anni
Minima:
-4.184
1 gen 1998 anni
Massimo:
14.306
1 gen 1992 anni
Alla data di osservazione
Valore
Variazione assoluta
La variazione rispetto al valore precedente
1 gen 1962 anni
1.788
+1.788
0.0%
1 gen 1963 anni
10.645
+8.857
495.33%
1 gen 1964 anni
3.292
-7.353
-69.08%
1 gen 1965 anni
-2.89
-6.182
-187.8%
1 gen 1966 anni
1.884
+4.774
-165.18%
1 gen 1967 anni
4.013
+2.129
112.98%
1 gen 1968 anni
8.019
+4.006
99.85%
1 gen 1969 anni
13.163
+5.144
64.15%
1 gen 1970 anni
1.668
-11.495
-87.33%
1 gen 1971 anni
-0.216
-1.884
-112.94%
1 gen 1972 anni
3.969
+4.184
-1.94 Mille.%
1 gen 1973 anni
4.312
+0.343
8.65%
1 gen 1974 anni
3.752
-0.56
-13.0%
1 gen 1975 anni
5.193
+1.442
38.43%
1 gen 1976 anni
11.294
+6.101
117.47%
1 gen 1977 anni
6.758
-4.536
-40.16%
1 gen 1978 anni
7.9
+1.142
16.91%
1 gen 1979 anni
7.214
-0.686
-8.68%
1 gen 1980 anni
6.448
-0.767
-10.63%
1 gen 1981 anni
-2.5
-8.948
-138.77%
1 gen 1982 anni
2.808
+5.308
-212.33%
1 gen 1983 anni
6.826
+4.018
143.08%
1 gen 1984 anni
8.587
+1.761
25.8%
1 gen 1985 anni
4.376
-4.211
-49.04%
1 gen 1986 anni
3.813
-0.563
-12.87%
1 gen 1987 anni
11.814
+8.001
209.86%
1 gen 1988 anni
2.049
-9.765
-82.65%
1 gen 1989 anni
9.352
+7.303
356.38%
1 gen 1990 anni
4.932
-4.42
-47.26%
1 gen 1991 anni
2.931
-2.001
-40.57%
1 gen 1992 anni
14.306
+11.374
388.04%
1 gen 1993 anni
-0.28
-14.586
-101.96%
1 gen 1994 anni
-1.489
-1.209
431.48%
1 gen 1995 anni
12.782
+14.271
-958.49%
1 gen 1996 anni
-3.965
-16.747
-131.02%
1 gen 1997 anni
13.559
+17.524
-441.97%
1 gen 1998 anni
-4.184
-17.744
-130.86%
1 gen 1999 anni
5.774
+9.958
-237.98%
1 gen 2000 anni
1.702
-4.072
-70.52%
1 gen 2001 anni
1.847
+0.145
8.51%
1 gen 2002 anni
1.206
-0.64
-34.68%
1 gen 2003 anni
3.505
+2.299
190.59%
1 gen 2004 anni
6.015
+2.509
71.58%
1 gen 2005 anni
4.459
-1.555
-25.86%
1 gen 2006 anni
3.325
-1.134
-25.43%
1 gen 2007 anni
6.493
+3.167
95.24%
1 gen 2008 anni
4.574
-1.919
-29.55%
1 gen 2009 anni
7.54
+2.965
64.83%
1 gen 2010 anni
4.026
-3.513
-46.6%
1 gen 2011 anni
4.066
+0.039
0.98%
1 gen 2012 anni
5.502
+1.437
35.34%
1 gen 2013 anni
4.155
-1.347
-24.48%
1 gen 2014 anni
2.375
-1.781
-42.85%
1 gen 2015 anni
3.501
+1.126
47.42%
1 gen 2016 anni
2.381
-1.12
-31.98%
Classificazione dei paesi secondo i statistiche attuali per anni


Commenti: