29
/it/
it
AIzaSyAYiBZKx7MnpbEhh9jyipgxe19OcubqV5w
April 1, 2024
182170
Luxembourg
LUX
true
2
1
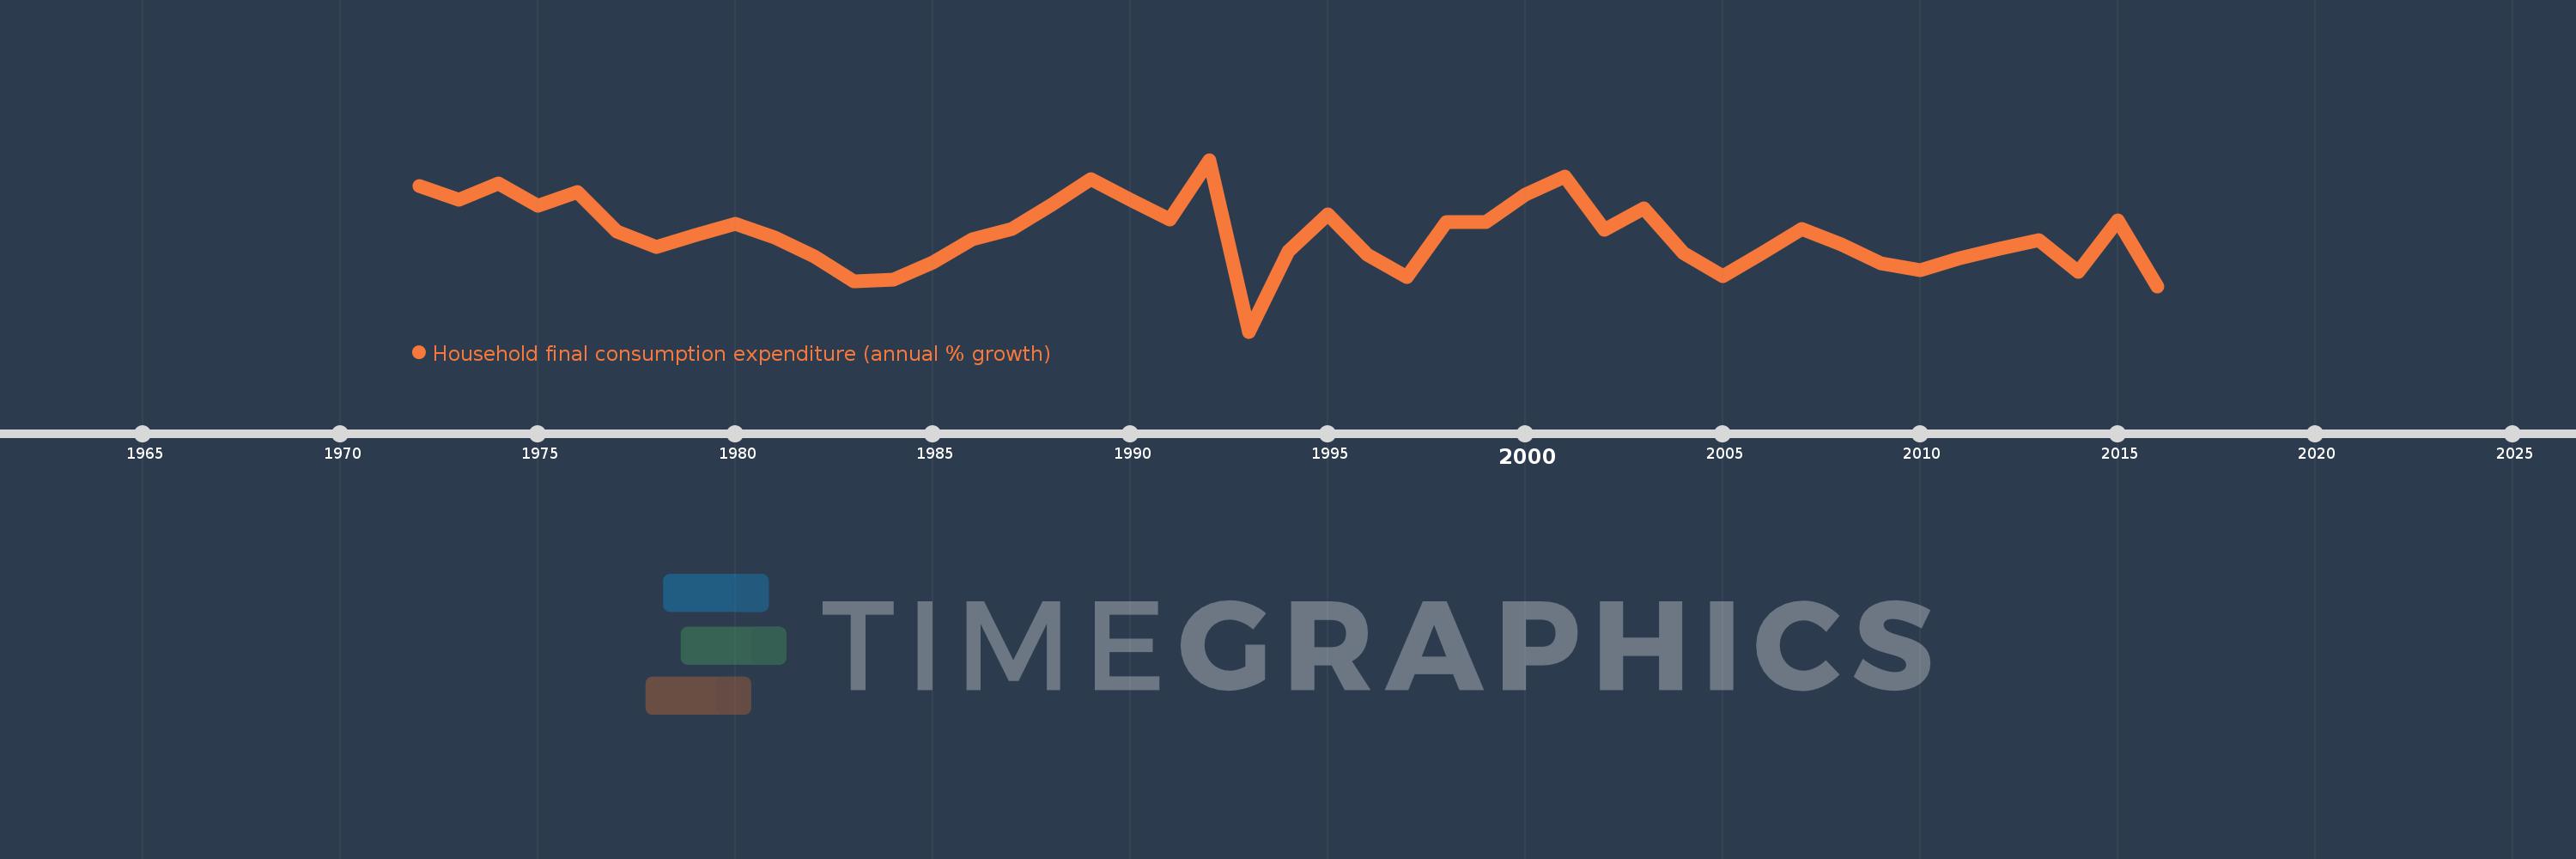
Household final consumption expenditure (annual % growth)
2016,2015,2014,2013,2012,2011,2010,2009,2008,2007,2006,2005,2004,2003,2002,2001,2000,1999,1998,1997,1996,1995,1994,1993,1992,1991,1990,1989,1988,1987,1986,1985,1984,1983,1982,1981,1980,1979,1978,1977,1976,1975,1974,1973,1972
Queste statistiche in altri paesi:
AlbaniaAlgeriaAntigua and BarbudaArab WorldArgentinaArmeniaAustraliaAustriaAzerbaijanBahamas, TheBahrainBangladeshBarbadosBelarusBelgiumBelizeBeninBhutanBoliviaBosnia and HerzegovinaBotswanaBrazilBrunei DarussalamBulgariaBurkina FasoBurundiCabo VerdeCambodiaCameroonCanadaCaribbean small statesCentral Europe and the BalticsChadChileChinaColombiaComorosCongo, Dem. Rep.Congo, Rep.Costa RicaCote d'IvoireCroatiaCubaCyprusCzech RepublicDenmarkDominican RepublicEarly-demographic dividendEast Asia & PacificEast Asia & Pacific (excluding high income)East Asia & Pacific (IDA & IBRD countries)EcuadorEgypt, Arab Rep.El SalvadorEquatorial GuineaEritreaEstoniaEthiopiaEuro areaEurope & Central AsiaEurope & Central Asia (excluding high income)Europe & Central Asia (IDA & IBRD countries)European UnionFinlandFranceGabonGambia, TheGeorgiaGermanyGhanaGreeceGuatemalaGuineaGuinea-BissauHaitiHeavily indebted poor countries (HIPC)High incomeHondurasHong Kong SAR, ChinaHungaryIBRD onlyIcelandIDA & IBRD totalIDA blendIDA onlyIDA totalIndiaIndonesiaIran, Islamic Rep.IrelandIsraelItalyJamaicaJapanJordanKazakhstanKenyaKorea, Rep.KosovoKuwaitKyrgyz RepublicLao PDRLate-demographic dividendLatin America & Caribbean Latin America & Caribbean (excluding high income)Latin America & the Caribbean (IDA & IBRD countries)LatviaLeast developed countries: UN classificationLebanonLiberiaLithuaniaLow & middle incomeLow incomeLower middle incomeLuxembourgMacao SAR, ChinaMacedonia, FYRMadagascarMalawiMalaysiaMaliMaltaMauritaniaMauritiusMexicoMiddle East & North AfricaMiddle East & North Africa (excluding high income)Middle East & North Africa (IDA & IBRD countries)Middle incomeMoldovaMongoliaMontenegroMoroccoMozambiqueNamibiaNepalNetherlandsNew ZealandNicaraguaNigerNigeriaNorth AmericaNorwayOECD membersOmanOther small statesPakistanPanamaPapua New GuineaParaguayPeruPhilippinesPolandPortugalPost-demographic dividendPre-demographic dividendPuerto RicoQatarRomaniaRussian FederationRwandaSaudi ArabiaSenegalSerbiaSeychellesSierra LeoneSingaporeSlovak RepublicSloveniaSmall statesSomaliaSouth AfricaSouth AsiaSouth Asia (IDA & IBRD)South SudanSpainSri LankaSub-Saharan Africa Sub-Saharan Africa (excluding high income)Sub-Saharan Africa (IDA & IBRD countries)SudanSurinameSwazilandSwedenSwitzerlandSyrian Arab RepublicTajikistanTanzaniaThailandTimor-LesteTogoTrinidad and TobagoTunisiaTurkeyTurkmenistanUgandaUkraineUnited Arab EmiratesUnited KingdomUnited StatesUpper middle incomeUruguayVanuatuVenezuela, RBVietnamWest Bank and GazaWorldZimbabwe Linea del tempo:
Questa scala temporale mostra un grafico dal 1972 anno al 2016 anno. Luxembourg. I dati fino ad 1971 anno non disponibili. Il numero di osservazioni attuali secondo i date: 45.
La fonte (nome):
Indicatori dello sviluppo mondiale
La fonte (organizzazione):
World Bank national accounts data, and OECD National Accounts data files.
Categorie:
Economy & Growth
sono stati aggiornati
23 apr 2017 anni
Indicatori delle variazioni dei valori per anni
Minima:
-2.33
1 gen 1993 anni
Massimo:
7.024
1 gen 1992 anni
Alla data di osservazione
Valore
Variazione assoluta
La variazione rispetto al valore precedente
1 gen 1972 anni
5.619
+5.619
0.0%
1 gen 1973 anni
4.844
-0.776
-13.8%
1 gen 1974 anni
5.756
+0.912
18.82%
1 gen 1975 anni
4.5
-1.256
-21.83%
1 gen 1976 anni
5.274
+0.774
17.21%
1 gen 1977 anni
3.14
-2.134
-40.47%
1 gen 1978 anni
2.286
-0.854
-27.2%
1 gen 1979 anni
2.95
+0.664
29.06%
1 gen 1980 anni
3.532
+0.582
19.73%
1 gen 1981 anni
2.812
-0.72
-20.37%
1 gen 1982 anni
1.739
-1.073
-38.15%
1 gen 1983 anni
0.394
-1.345
-77.34%
1 gen 1984 anni
0.492
+0.098
24.95%
1 gen 1985 anni
1.446
+0.953
193.62%
1 gen 1986 anni
2.699
+1.254
86.71%
1 gen 1987 anni
3.266
+0.567
21.0%
1 gen 1988 anni
4.582
+1.316
40.29%
1 gen 1989 anni
5.974
+1.392
30.39%
1 gen 1990 anni
4.833
-1.141
-19.1%
1 gen 1991 anni
3.778
-1.056
-21.84%
1 gen 1992 anni
7.024
+3.246
85.93%
1 gen 1993 anni
-2.33
-9.354
-133.17%
1 gen 1994 anni
2.054
+4.384
-188.18%
1 gen 1995 anni
4.044
+1.989
96.84%
1 gen 1996 anni
1.879
-2.164
-53.53%
1 gen 1997 anni
0.637
-1.242
-66.08%
1 gen 1998 anni
3.643
+3.005
471.43%
1 gen 1999 anni
3.656
+0.013
0.36%
1 gen 2000 anni
5.145
+1.49
40.75%
1 gen 2001 anni
6.123
+0.978
19.01%
1 gen 2002 anni
3.199
-2.925
-47.76%
1 gen 2003 anni
4.375
+1.176
36.78%
1 gen 2004 anni
1.952
-2.423
-55.39%
1 gen 2005 anni
0.671
-1.28
-65.61%
1 gen 2006 anni
1.929
+1.258
187.39%
1 gen 2007 anni
3.262
+1.333
69.11%
1 gen 2008 anni
2.415
-0.847
-25.98%
1 gen 2009 anni
1.368
-1.047
-43.37%
1 gen 2010 anni
0.997
-0.371
-27.13%
1 gen 2011 anni
1.662
+0.666
66.82%
1 gen 2012 anni
2.186
+0.524
31.49%
1 gen 2013 anni
2.665
+0.479
21.9%
1 gen 2014 anni
0.943
-1.722
-64.62%
1 gen 2015 anni
3.715
+2.772
294.04%
1 gen 2016 anni
0.139
-3.575
-96.25%
Classificazione dei paesi secondo i statistiche attuali per anni


Commenti: