29
/it/
it
AIzaSyAYiBZKx7MnpbEhh9jyipgxe19OcubqV5w
April 1, 2024
51076
Middle income
MIC
false
2
1
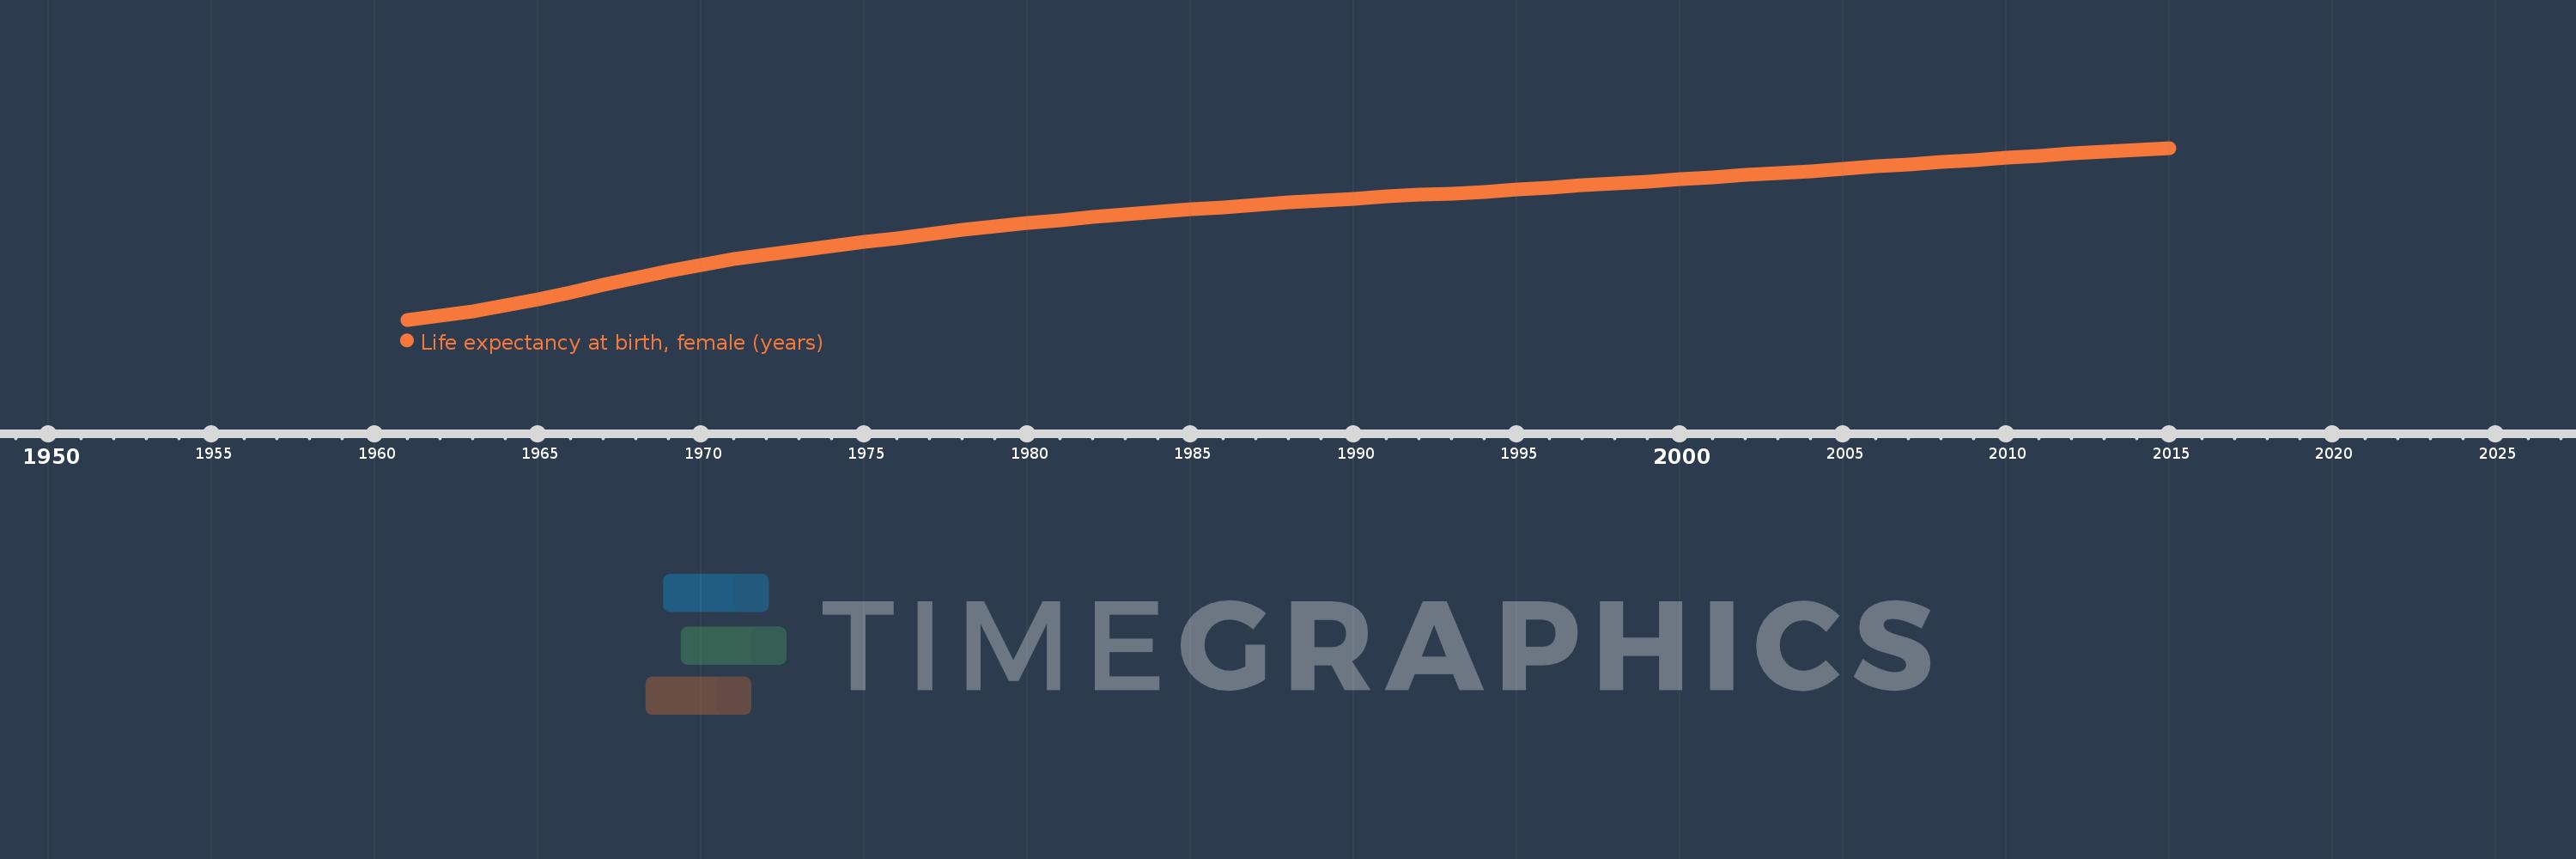
Life expectancy at birth, female (years)
2015,2014,2013,2012,2011,2010,2009,2008,2007,2006,2005,2004,2003,2002,2001,2000,1999,1998,1997,1996,1995,1994,1993,1992,1991,1990,1989,1988,1987,1986,1985,1984,1983,1982,1981,1980,1979,1978,1977,1976,1975,1974,1973,1972,1971,1970,1969,1968,1967,1966,1965,1964,1963,1962,1961
Queste statistiche in altri paesi:
AfghanistanAlbaniaAlgeriaAngolaAntigua and BarbudaArab WorldArgentinaArmeniaArubaAustraliaAustriaAzerbaijanBahamas, TheBahrainBangladeshBarbadosBelarusBelgiumBelizeBeninBermudaBhutanBoliviaBosnia and HerzegovinaBotswanaBrazilBrunei DarussalamBulgariaBurkina FasoBurundiCabo VerdeCambodiaCameroonCanadaCaribbean small statesCentral African RepublicCentral Europe and the BalticsChadChannel IslandsChileChinaColombiaComorosCongo, Dem. Rep.Congo, Rep.Costa RicaCote d'IvoireCroatiaCubaCuracaoCyprusCzech RepublicDenmarkDjiboutiDominicaDominican RepublicEarly-demographic dividendEast Asia & PacificEast Asia & Pacific (excluding high income)East Asia & Pacific (IDA & IBRD countries)EcuadorEgypt, Arab Rep.El SalvadorEquatorial GuineaEritreaEstoniaEthiopiaEuro areaEurope & Central AsiaEurope & Central Asia (excluding high income)Europe & Central Asia (IDA & IBRD countries)European UnionFaroe IslandsFijiFinlandFragile and conflict affected situationsFranceFrench PolynesiaGabonGambia, TheGeorgiaGermanyGhanaGreeceGreenlandGrenadaGuamGuatemalaGuineaGuinea-BissauGuyanaHaitiHeavily indebted poor countries (HIPC)High incomeHondurasHong Kong SAR, ChinaHungaryIBRD onlyIcelandIDA & IBRD totalIDA blendIDA onlyIDA totalIndiaIndonesiaIran, Islamic Rep.IraqIrelandIsle of ManIsraelItalyJamaicaJapanJordanKazakhstanKenyaKiribatiKorea, Dem. People’s Rep.Korea, Rep.KosovoKuwaitKyrgyz RepublicLao PDRLate-demographic dividendLatin America & Caribbean Latin America & Caribbean (excluding high income)Latin America & the Caribbean (IDA & IBRD countries)LatviaLeast developed countries: UN classificationLebanonLesothoLiberiaLibyaLiechtensteinLithuaniaLow & middle incomeLow incomeLower middle incomeLuxembourgMacao SAR, ChinaMacedonia, FYRMadagascarMalawiMalaysiaMaldivesMaliMaltaMarshall IslandsMauritaniaMauritiusMexicoMicronesia, Fed. Sts.Middle East & North AfricaMiddle East & North Africa (excluding high income)Middle East & North Africa (IDA & IBRD countries)Middle incomeMoldovaMongoliaMontenegroMoroccoMozambiqueMyanmarNamibiaNepalNetherlandsNew CaledoniaNew ZealandNicaraguaNigerNigeriaNorth AmericaNorwayOECD membersOmanOther small statesPacific island small statesPakistanPalauPanamaPapua New GuineaParaguayPeruPhilippinesPolandPortugalPost-demographic dividendPre-demographic dividendPuerto RicoQatarRomaniaRussian FederationRwandaSamoaSan MarinoSao Tome and PrincipeSaudi ArabiaSenegalSerbiaSeychellesSierra LeoneSingaporeSint Maarten (Dutch part)Slovak RepublicSloveniaSmall statesSolomon IslandsSomaliaSouth AfricaSouth AsiaSouth Asia (IDA & IBRD)South SudanSpainSri LankaSt. Kitts and NevisSt. LuciaSt. Martin (French part)St. Vincent and the GrenadinesSub-Saharan Africa Sub-Saharan Africa (excluding high income)Sub-Saharan Africa (IDA & IBRD countries)SudanSurinameSwazilandSwedenSwitzerlandSyrian Arab RepublicTajikistanTanzaniaThailandTimor-LesteTogoTongaTrinidad and TobagoTunisiaTurkeyTurkmenistanUgandaUkraineUnited Arab EmiratesUnited KingdomUnited StatesUpper middle incomeUruguayUzbekistanVanuatuVenezuela, RBVietnamVirgin Islands (U.S.)West Bank and GazaWorldYemen, Rep.ZambiaZimbabwe Linea del tempo:
Questa scala temporale mostra un grafico dal 1961 anno al 2015 anno. Middle income. I dati fino ad 1960 anno non disponibili. Il numero di osservazioni attuali secondo i date: 55.
La fonte (nome):
Indicatori dello sviluppo mondiale
La fonte (organizzazione):
(1) United Nations Population Division. World Population Prospects, (2) Census reports and other statistical publications from national statistical offices, (3) Eurostat: Demographic Statistics, (4) United Nations Statistical Division. Population and Vital Statistics Reprot (various years), (5) U.S. Census Bureau: International Database, and (6) Secretariat of the Pacific Community: Statistics and Demography Programme.
Categorie:
Health, Gender, Social Development
sono stati aggiornati
23 apr 2017 anni
Indicatori delle variazioni dei valori per anni
Minima:
49.269
1 gen 1961 anni
Massimo:
72.749
1 gen 2015 anni
Alla data di osservazione
Valore
Variazione assoluta
La variazione rispetto al valore precedente
1 gen 1961 anni
49.269
+49.269
0.0%
1 gen 1962 anni
49.803
+0.534
1.08%
1 gen 1963 anni
50.428
+0.625
1.26%
1 gen 1964 anni
51.174
+0.746
1.48%
1 gen 1965 anni
52.055
+0.881
1.72%
1 gen 1966 anni
53.029
+0.973
1.87%
1 gen 1967 anni
54.037
+1.009
1.9%
1 gen 1968 anni
55.026
+0.989
1.83%
1 gen 1969 anni
55.948
+0.922
1.68%
1 gen 1970 anni
56.772
+0.824
1.47%
1 gen 1971 anni
57.535
+0.762
1.34%
1 gen 1972 anni
58.192
+0.657
1.14%
1 gen 1973 anni
58.771
+0.579
1.0%
1 gen 1974 anni
59.343
+0.572
0.97%
1 gen 1975 anni
59.916
+0.573
0.97%
1 gen 1976 anni
60.441
+0.525
0.88%
1 gen 1977 anni
60.976
+0.535
0.89%
1 gen 1978 anni
61.507
+0.53
0.87%
1 gen 1979 anni
62.005
+0.498
0.81%
1 gen 1980 anni
62.462
+0.458
0.74%
1 gen 1981 anni
62.902
+0.44
0.7%
1 gen 1982 anni
63.314
+0.412
0.65%
1 gen 1983 anni
63.703
+0.389
0.61%
1 gen 1984 anni
64.04
+0.337
0.53%
1 gen 1985 anni
64.342
+0.301
0.47%
1 gen 1986 anni
64.654
+0.312
0.48%
1 gen 1987 anni
64.985
+0.332
0.51%
1 gen 1988 anni
65.271
+0.286
0.44%
1 gen 1989 anni
65.552
+0.282
0.43%
1 gen 1990 anni
65.828
+0.276
0.42%
1 gen 1991 anni
66.099
+0.271
0.41%
1 gen 1992 anni
66.354
+0.254
0.38%
1 gen 1993 anni
66.544
+0.191
0.29%
1 gen 1994 anni
66.774
+0.229
0.34%
1 gen 1995 anni
67.055
+0.282
0.42%
1 gen 1996 anni
67.351
+0.296
0.44%
1 gen 1997 anni
67.638
+0.287
0.43%
1 gen 1998 anni
67.939
+0.301
0.45%
1 gen 1999 anni
68.192
+0.253
0.37%
1 gen 2000 anni
68.474
+0.283
0.41%
1 gen 2001 anni
68.751
+0.277
0.4%
1 gen 2002 anni
69.048
+0.297
0.43%
1 gen 2003 anni
69.32
+0.272
0.39%
1 gen 2004 anni
69.602
+0.282
0.41%
1 gen 2005 anni
69.909
+0.306
0.44%
1 gen 2006 anni
70.201
+0.292
0.42%
1 gen 2007 anni
70.52
+0.319
0.45%
1 gen 2008 anni
70.833
+0.313
0.44%
1 gen 2009 anni
71.126
+0.293
0.41%
1 gen 2010 anni
71.432
+0.306
0.43%
1 gen 2011 anni
71.714
+0.282
0.39%
1 gen 2012 anni
72.004
+0.29
0.4%
1 gen 2013 anni
72.269
+0.264
0.37%
1 gen 2014 anni
72.515
+0.247
0.34%
1 gen 2015 anni
72.749
+0.234
0.32%
Classificazione dei paesi secondo i statistiche attuali per anni


Commenti: