29
/it/
it
AIzaSyAYiBZKx7MnpbEhh9jyipgxe19OcubqV5w
April 1, 2024
216664
Pakistan
PAK
true
2
1
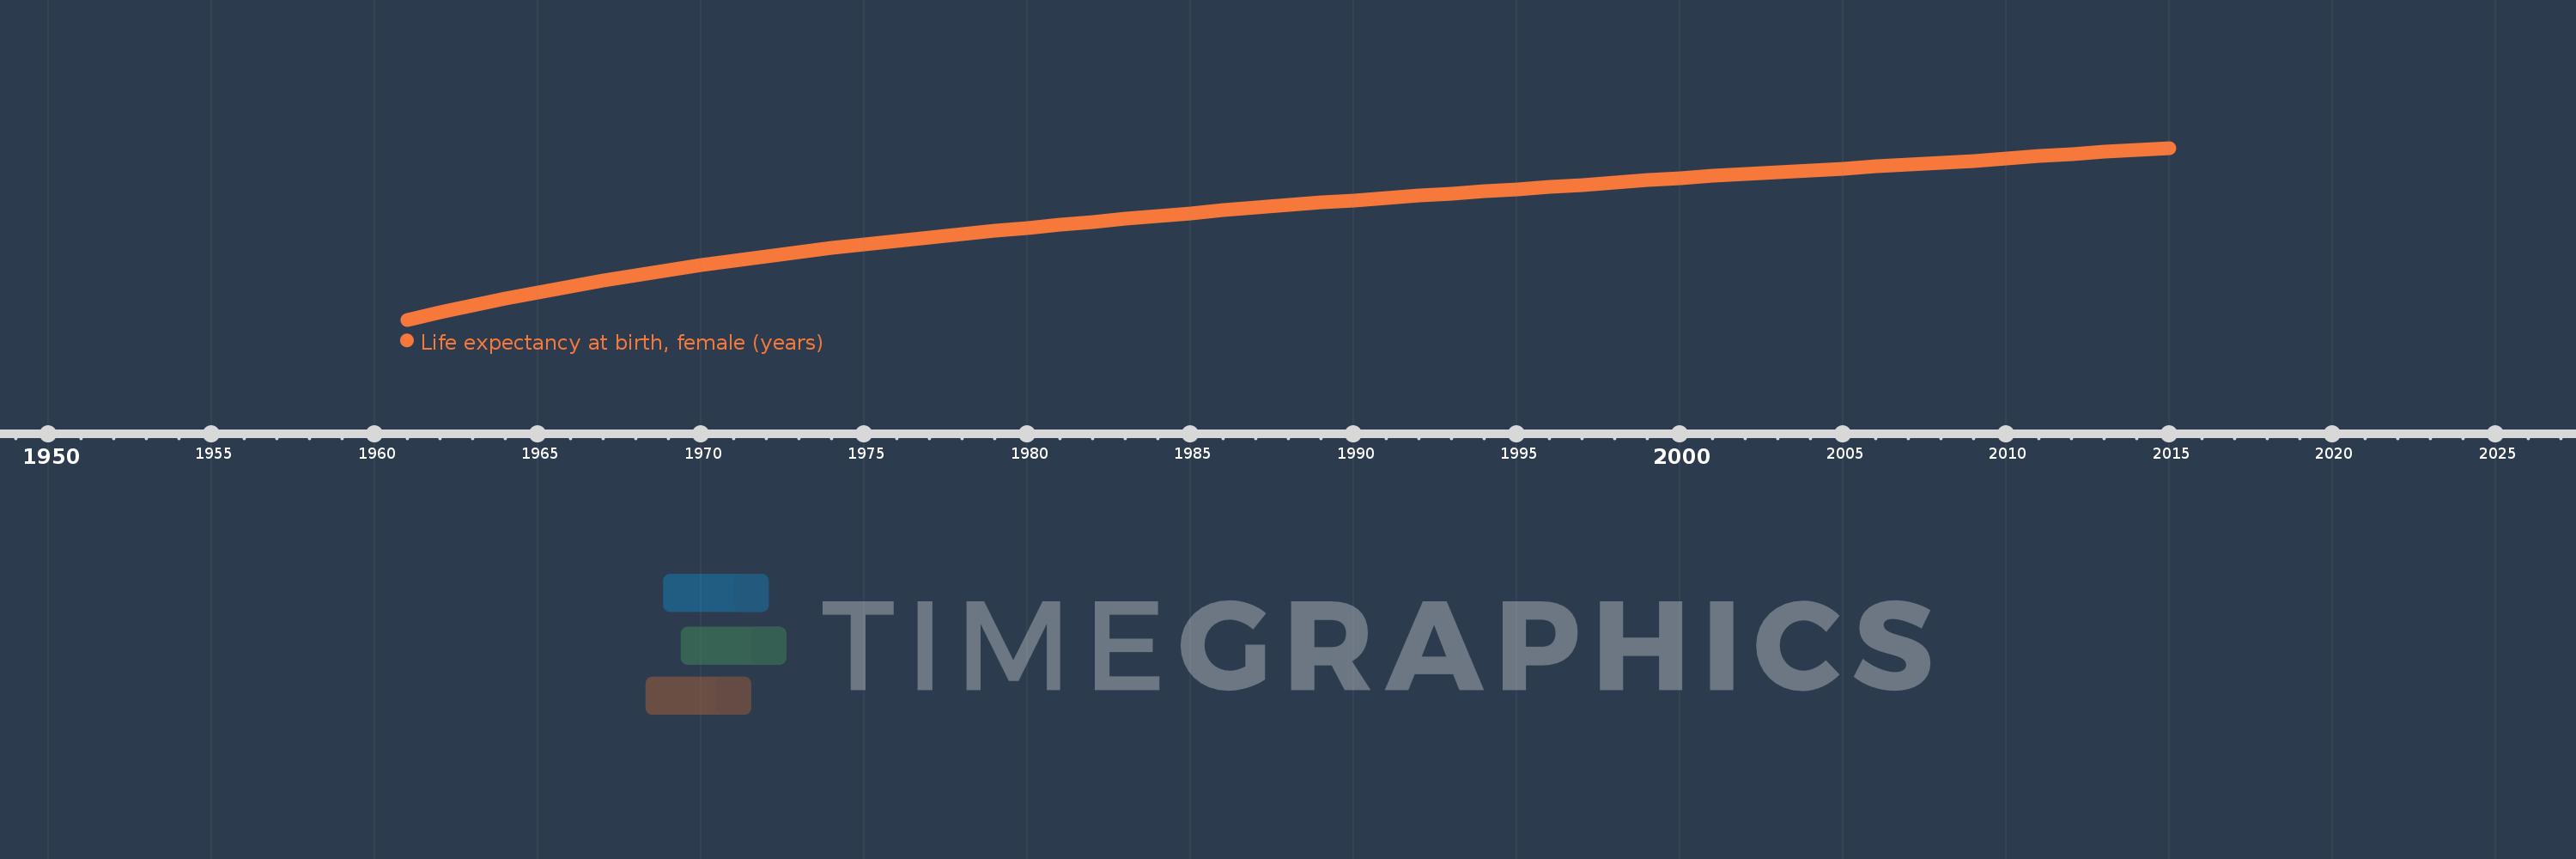
Life expectancy at birth, female (years)
2015,2014,2013,2012,2011,2010,2009,2008,2007,2006,2005,2004,2003,2002,2001,2000,1999,1998,1997,1996,1995,1994,1993,1992,1991,1990,1989,1988,1987,1986,1985,1984,1983,1982,1981,1980,1979,1978,1977,1976,1975,1974,1973,1972,1971,1970,1969,1968,1967,1966,1965,1964,1963,1962,1961
Queste statistiche in altri paesi:
AfghanistanAlbaniaAlgeriaAngolaAntigua and BarbudaArab WorldArgentinaArmeniaArubaAustraliaAustriaAzerbaijanBahamas, TheBahrainBangladeshBarbadosBelarusBelgiumBelizeBeninBermudaBhutanBoliviaBosnia and HerzegovinaBotswanaBrazilBrunei DarussalamBulgariaBurkina FasoBurundiCabo VerdeCambodiaCameroonCanadaCaribbean small statesCentral African RepublicCentral Europe and the BalticsChadChannel IslandsChileChinaColombiaComorosCongo, Dem. Rep.Congo, Rep.Costa RicaCote d'IvoireCroatiaCubaCuracaoCyprusCzech RepublicDenmarkDjiboutiDominicaDominican RepublicEarly-demographic dividendEast Asia & PacificEast Asia & Pacific (excluding high income)East Asia & Pacific (IDA & IBRD countries)EcuadorEgypt, Arab Rep.El SalvadorEquatorial GuineaEritreaEstoniaEthiopiaEuro areaEurope & Central AsiaEurope & Central Asia (excluding high income)Europe & Central Asia (IDA & IBRD countries)European UnionFaroe IslandsFijiFinlandFragile and conflict affected situationsFranceFrench PolynesiaGabonGambia, TheGeorgiaGermanyGhanaGreeceGreenlandGrenadaGuamGuatemalaGuineaGuinea-BissauGuyanaHaitiHeavily indebted poor countries (HIPC)High incomeHondurasHong Kong SAR, ChinaHungaryIBRD onlyIcelandIDA & IBRD totalIDA blendIDA onlyIDA totalIndiaIndonesiaIran, Islamic Rep.IraqIrelandIsle of ManIsraelItalyJamaicaJapanJordanKazakhstanKenyaKiribatiKorea, Dem. People’s Rep.Korea, Rep.KosovoKuwaitKyrgyz RepublicLao PDRLate-demographic dividendLatin America & Caribbean Latin America & Caribbean (excluding high income)Latin America & the Caribbean (IDA & IBRD countries)LatviaLeast developed countries: UN classificationLebanonLesothoLiberiaLibyaLiechtensteinLithuaniaLow & middle incomeLow incomeLower middle incomeLuxembourgMacao SAR, ChinaMacedonia, FYRMadagascarMalawiMalaysiaMaldivesMaliMaltaMarshall IslandsMauritaniaMauritiusMexicoMicronesia, Fed. Sts.Middle East & North AfricaMiddle East & North Africa (excluding high income)Middle East & North Africa (IDA & IBRD countries)Middle incomeMoldovaMongoliaMontenegroMoroccoMozambiqueMyanmarNamibiaNepalNetherlandsNew CaledoniaNew ZealandNicaraguaNigerNigeriaNorth AmericaNorwayOECD membersOmanOther small statesPacific island small statesPakistanPalauPanamaPapua New GuineaParaguayPeruPhilippinesPolandPortugalPost-demographic dividendPre-demographic dividendPuerto RicoQatarRomaniaRussian FederationRwandaSamoaSan MarinoSao Tome and PrincipeSaudi ArabiaSenegalSerbiaSeychellesSierra LeoneSingaporeSint Maarten (Dutch part)Slovak RepublicSloveniaSmall statesSolomon IslandsSomaliaSouth AfricaSouth AsiaSouth Asia (IDA & IBRD)South SudanSpainSri LankaSt. Kitts and NevisSt. LuciaSt. Martin (French part)St. Vincent and the GrenadinesSub-Saharan Africa Sub-Saharan Africa (excluding high income)Sub-Saharan Africa (IDA & IBRD countries)SudanSurinameSwazilandSwedenSwitzerlandSyrian Arab RepublicTajikistanTanzaniaThailandTimor-LesteTogoTongaTrinidad and TobagoTunisiaTurkeyTurkmenistanUgandaUkraineUnited Arab EmiratesUnited KingdomUnited StatesUpper middle incomeUruguayUzbekistanVanuatuVenezuela, RBVietnamVirgin Islands (U.S.)West Bank and GazaWorldYemen, Rep.ZambiaZimbabwe Linea del tempo:
Questa scala temporale mostra un grafico dal 1961 anno al 2015 anno. Pakistan. I dati fino ad 1960 anno non disponibili. Il numero di osservazioni attuali secondo i date: 55.
La fonte (nome):
Indicatori dello sviluppo mondiale
La fonte (organizzazione):
(1) United Nations Population Division. World Population Prospects, (2) Census reports and other statistical publications from national statistical offices, (3) Eurostat: Demographic Statistics, (4) United Nations Statistical Division. Population and Vital Statistics Reprot (various years), (5) U.S. Census Bureau: International Database, and (6) Secretariat of the Pacific Community: Statistics and Demography Programme.
Categorie:
Health, Gender, Social Development
sono stati aggiornati
23 apr 2017 anni
Indicatori delle variazioni dei valori per anni
Minima:
45.481
1 gen 1961 anni
Massimo:
67.155
1 gen 2015 anni
Alla data di osservazione
Valore
Variazione assoluta
La variazione rispetto al valore precedente
1 gen 1961 anni
45.481
+45.481
0.0%
1 gen 1962 anni
46.403
+0.922
2.03%
1 gen 1963 anni
47.286
+0.883
1.9%
1 gen 1964 anni
48.129
+0.843
1.78%
1 gen 1965 anni
48.932
+0.803
1.67%
1 gen 1966 anni
49.694
+0.762
1.56%
1 gen 1967 anni
50.415
+0.721
1.45%
1 gen 1968 anni
51.096
+0.681
1.35%
1 gen 1969 anni
51.741
+0.645
1.26%
1 gen 1970 anni
52.352
+0.611
1.18%
1 gen 1971 anni
52.931
+0.579
1.11%
1 gen 1972 anni
53.481
+0.55
1.04%
1 gen 1973 anni
54.002
+0.521
0.97%
1 gen 1974 anni
54.499
+0.497
0.92%
1 gen 1975 anni
54.975
+0.476
0.87%
1 gen 1976 anni
55.431
+0.456
0.83%
1 gen 1977 anni
55.869
+0.438
0.79%
1 gen 1978 anni
56.289
+0.42
0.75%
1 gen 1979 anni
56.695
+0.406
0.72%
1 gen 1980 anni
57.087
+0.392
0.69%
1 gen 1981 anni
57.468
+0.381
0.67%
1 gen 1982 anni
57.842
+0.374
0.65%
1 gen 1983 anni
58.208
+0.366
0.63%
1 gen 1984 anni
58.568
+0.36
0.62%
1 gen 1985 anni
58.92
+0.352
0.6%
1 gen 1986 anni
59.266
+0.346
0.59%
1 gen 1987 anni
59.602
+0.336
0.57%
1 gen 1988 anni
59.927
+0.325
0.55%
1 gen 1989 anni
60.241
+0.314
0.52%
1 gen 1990 anni
60.544
+0.303
0.5%
1 gen 1991 anni
60.837
+0.293
0.48%
1 gen 1992 anni
61.122
+0.285
0.47%
1 gen 1993 anni
61.402
+0.28
0.46%
1 gen 1994 anni
61.678
+0.276
0.45%
1 gen 1995 anni
61.953
+0.275
0.45%
1 gen 1996 anni
62.229
+0.276
0.45%
1 gen 1997 anni
62.506
+0.277
0.45%
1 gen 1998 anni
62.783
+0.277
0.44%
1 gen 1999 anni
63.061
+0.278
0.44%
1 gen 2000 anni
63.336
+0.275
0.44%
1 gen 2001 anni
63.606
+0.27
0.43%
1 gen 2002 anni
63.866
+0.26
0.41%
1 gen 2003 anni
64.112
+0.246
0.39%
1 gen 2004 anni
64.347
+0.235
0.37%
1 gen 2005 anni
64.572
+0.225
0.35%
1 gen 2006 anni
64.796
+0.224
0.35%
1 gen 2007 anni
65.028
+0.232
0.36%
1 gen 2008 anni
65.274
+0.246
0.38%
1 gen 2009 anni
65.537
+0.263
0.4%
1 gen 2010 anni
65.817
+0.28
0.43%
1 gen 2011 anni
66.105
+0.288
0.44%
1 gen 2012 anni
66.392
+0.287
0.43%
1 gen 2013 anni
66.667
+0.275
0.41%
1 gen 2014 anni
66.922
+0.255
0.38%
1 gen 2015 anni
67.155
+0.233
0.35%
Classificazione dei paesi secondo i statistiche attuali per anni


Commenti: