29
/it/
it
AIzaSyAYiBZKx7MnpbEhh9jyipgxe19OcubqV5w
April 1, 2024
168772
Kiribati
KIR
true
2
1
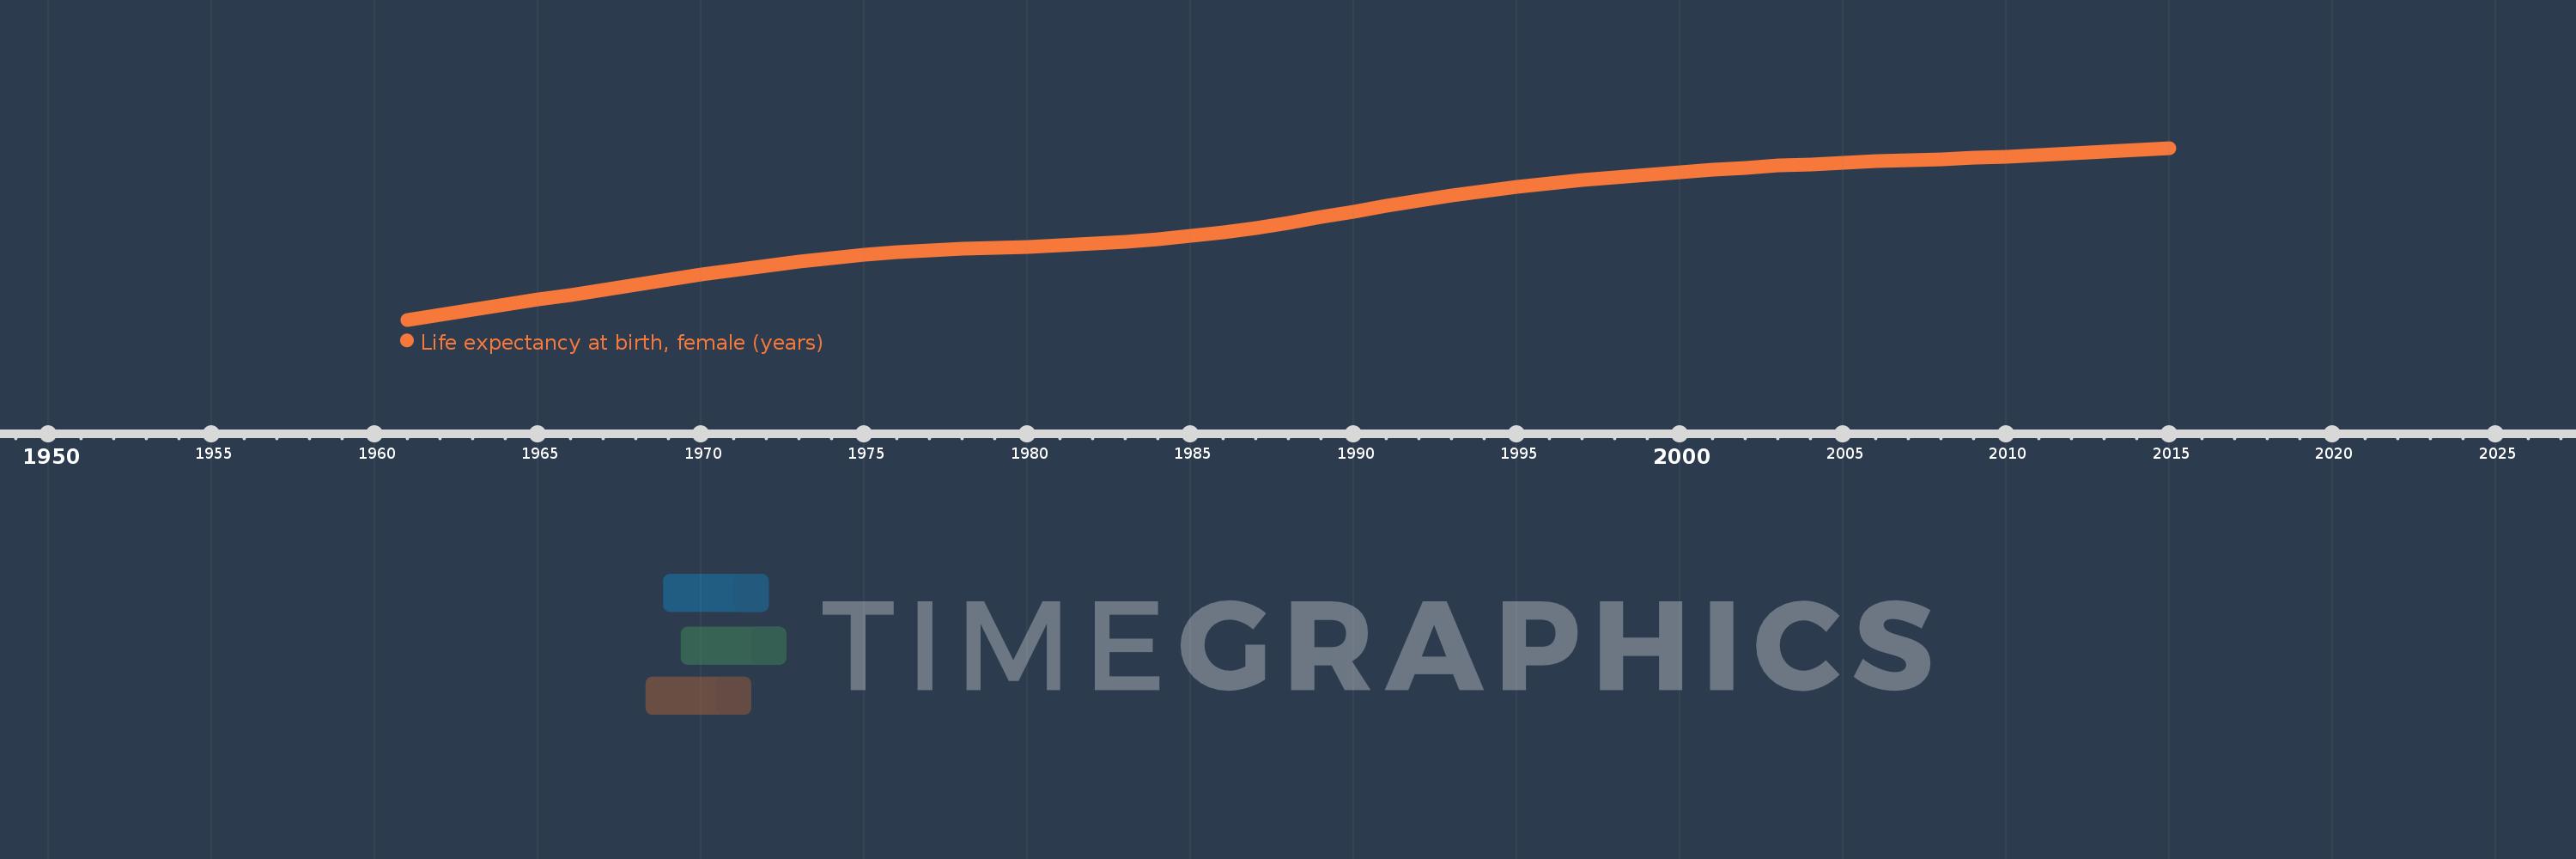
Life expectancy at birth, female (years)
2015,2014,2013,2012,2011,2010,2009,2008,2007,2006,2005,2004,2003,2002,2001,2000,1999,1998,1997,1996,1995,1994,1993,1992,1991,1990,1989,1988,1987,1986,1985,1984,1983,1982,1981,1980,1979,1978,1977,1976,1975,1974,1973,1972,1971,1970,1969,1968,1967,1966,1965,1964,1963,1962,1961
Queste statistiche in altri paesi:
AfghanistanAlbaniaAlgeriaAngolaAntigua and BarbudaArab WorldArgentinaArmeniaArubaAustraliaAustriaAzerbaijanBahamas, TheBahrainBangladeshBarbadosBelarusBelgiumBelizeBeninBermudaBhutanBoliviaBosnia and HerzegovinaBotswanaBrazilBrunei DarussalamBulgariaBurkina FasoBurundiCabo VerdeCambodiaCameroonCanadaCaribbean small statesCentral African RepublicCentral Europe and the BalticsChadChannel IslandsChileChinaColombiaComorosCongo, Dem. Rep.Congo, Rep.Costa RicaCote d'IvoireCroatiaCubaCuracaoCyprusCzech RepublicDenmarkDjiboutiDominicaDominican RepublicEarly-demographic dividendEast Asia & PacificEast Asia & Pacific (excluding high income)East Asia & Pacific (IDA & IBRD countries)EcuadorEgypt, Arab Rep.El SalvadorEquatorial GuineaEritreaEstoniaEthiopiaEuro areaEurope & Central AsiaEurope & Central Asia (excluding high income)Europe & Central Asia (IDA & IBRD countries)European UnionFaroe IslandsFijiFinlandFragile and conflict affected situationsFranceFrench PolynesiaGabonGambia, TheGeorgiaGermanyGhanaGreeceGreenlandGrenadaGuamGuatemalaGuineaGuinea-BissauGuyanaHaitiHeavily indebted poor countries (HIPC)High incomeHondurasHong Kong SAR, ChinaHungaryIBRD onlyIcelandIDA & IBRD totalIDA blendIDA onlyIDA totalIndiaIndonesiaIran, Islamic Rep.IraqIrelandIsle of ManIsraelItalyJamaicaJapanJordanKazakhstanKenyaKiribatiKorea, Dem. People’s Rep.Korea, Rep.KosovoKuwaitKyrgyz RepublicLao PDRLate-demographic dividendLatin America & Caribbean Latin America & Caribbean (excluding high income)Latin America & the Caribbean (IDA & IBRD countries)LatviaLeast developed countries: UN classificationLebanonLesothoLiberiaLibyaLiechtensteinLithuaniaLow & middle incomeLow incomeLower middle incomeLuxembourgMacao SAR, ChinaMacedonia, FYRMadagascarMalawiMalaysiaMaldivesMaliMaltaMarshall IslandsMauritaniaMauritiusMexicoMicronesia, Fed. Sts.Middle East & North AfricaMiddle East & North Africa (excluding high income)Middle East & North Africa (IDA & IBRD countries)Middle incomeMoldovaMongoliaMontenegroMoroccoMozambiqueMyanmarNamibiaNepalNetherlandsNew CaledoniaNew ZealandNicaraguaNigerNigeriaNorth AmericaNorwayOECD membersOmanOther small statesPacific island small statesPakistanPalauPanamaPapua New GuineaParaguayPeruPhilippinesPolandPortugalPost-demographic dividendPre-demographic dividendPuerto RicoQatarRomaniaRussian FederationRwandaSamoaSan MarinoSao Tome and PrincipeSaudi ArabiaSenegalSerbiaSeychellesSierra LeoneSingaporeSint Maarten (Dutch part)Slovak RepublicSloveniaSmall statesSolomon IslandsSomaliaSouth AfricaSouth AsiaSouth Asia (IDA & IBRD)South SudanSpainSri LankaSt. Kitts and NevisSt. LuciaSt. Martin (French part)St. Vincent and the GrenadinesSub-Saharan Africa Sub-Saharan Africa (excluding high income)Sub-Saharan Africa (IDA & IBRD countries)SudanSurinameSwazilandSwedenSwitzerlandSyrian Arab RepublicTajikistanTanzaniaThailandTimor-LesteTogoTongaTrinidad and TobagoTunisiaTurkeyTurkmenistanUgandaUkraineUnited Arab EmiratesUnited KingdomUnited StatesUpper middle incomeUruguayUzbekistanVanuatuVenezuela, RBVietnamVirgin Islands (U.S.)West Bank and GazaWorldYemen, Rep.ZambiaZimbabwe Linea del tempo:
Questa scala temporale mostra un grafico dal 1961 anno al 2015 anno. Kiribati. I dati fino ad 1960 anno non disponibili. Il numero di osservazioni attuali secondo i date: 55.
La fonte (nome):
Indicatori dello sviluppo mondiale
La fonte (organizzazione):
(1) United Nations Population Division. World Population Prospects, (2) Census reports and other statistical publications from national statistical offices, (3) Eurostat: Demographic Statistics, (4) United Nations Statistical Division. Population and Vital Statistics Reprot (various years), (5) U.S. Census Bureau: International Database, and (6) Secretariat of the Pacific Community: Statistics and Demography Programme.
Categorie:
Health, Gender, Social Development
sono stati aggiornati
23 apr 2017 anni
Indicatori delle variazioni dei valori per anni
Minima:
51.443
1 gen 1961 anni
Massimo:
69.241
1 gen 2015 anni
Alla data di osservazione
Valore
Variazione assoluta
La variazione rispetto al valore precedente
1 gen 1961 anni
51.443
+51.443
0.0%
1 gen 1962 anni
51.962
+0.519
1.01%
1 gen 1963 anni
52.488
+0.526
1.01%
1 gen 1964 anni
53.012
+0.524
1.0%
1 gen 1965 anni
53.526
+0.514
0.97%
1 gen 1966 anni
54.034
+0.508
0.95%
1 gen 1967 anni
54.542
+0.508
0.94%
1 gen 1968 anni
55.055
+0.513
0.94%
1 gen 1969 anni
55.575
+0.52
0.94%
1 gen 1970 anni
56.092
+0.517
0.93%
1 gen 1971 anni
56.593
+0.501
0.89%
1 gen 1972 anni
57.062
+0.469
0.83%
1 gen 1973 anni
57.485
+0.423
0.74%
1 gen 1974 anni
57.855
+0.37
0.64%
1 gen 1975 anni
58.169
+0.314
0.54%
1 gen 1976 anni
58.424
+0.255
0.44%
1 gen 1977 anni
58.62
+0.196
0.34%
1 gen 1978 anni
58.772
+0.152
0.26%
1 gen 1979 anni
58.9
+0.128
0.22%
1 gen 1980 anni
59.02
+0.12
0.2%
1 gen 1981 anni
59.154
+0.134
0.23%
1 gen 1982 anni
59.32
+0.166
0.28%
1 gen 1983 anni
59.532
+0.212
0.36%
1 gen 1984 anni
59.797
+0.265
0.45%
1 gen 1985 anni
60.123
+0.326
0.55%
1 gen 1986 anni
60.517
+0.394
0.66%
1 gen 1987 anni
60.982
+0.465
0.77%
1 gen 1988 anni
61.502
+0.52
0.85%
1 gen 1989 anni
62.059
+0.557
0.91%
1 gen 1990 anni
62.637
+0.578
0.93%
1 gen 1991 anni
63.214
+0.577
0.92%
1 gen 1992 anni
63.771
+0.557
0.88%
1 gen 1993 anni
64.293
+0.522
0.82%
1 gen 1994 anni
64.77
+0.477
0.74%
1 gen 1995 anni
65.194
+0.424
0.65%
1 gen 1996 anni
65.565
+0.371
0.57%
1 gen 1997 anni
65.89
+0.325
0.5%
1 gen 1998 anni
66.185
+0.295
0.45%
1 gen 1999 anni
66.461
+0.276
0.42%
1 gen 2000 anni
66.722
+0.261
0.39%
1 gen 2001 anni
66.967
+0.245
0.37%
1 gen 2002 anni
67.192
+0.225
0.34%
1 gen 2003 anni
67.392
+0.2
0.3%
1 gen 2004 anni
67.566
+0.174
0.26%
1 gen 2005 anni
67.719
+0.153
0.23%
1 gen 2006 anni
67.854
+0.135
0.2%
1 gen 2007 anni
67.979
+0.125
0.18%
1 gen 2008 anni
68.099
+0.12
0.18%
1 gen 2009 anni
68.224
+0.125
0.18%
1 gen 2010 anni
68.357
+0.133
0.19%
1 gen 2011 anni
68.504
+0.147
0.22%
1 gen 2012 anni
68.669
+0.165
0.24%
1 gen 2013 anni
68.848
+0.179
0.26%
1 gen 2014 anni
69.039
+0.191
0.28%
1 gen 2015 anni
69.241
+0.202
0.29%
Classificazione dei paesi secondo i statistiche attuali per anni


Commenti: