29
/it/
it
AIzaSyAYiBZKx7MnpbEhh9jyipgxe19OcubqV5w
April 1, 2024
25040
Caribbean small states
CSS
false
2
1
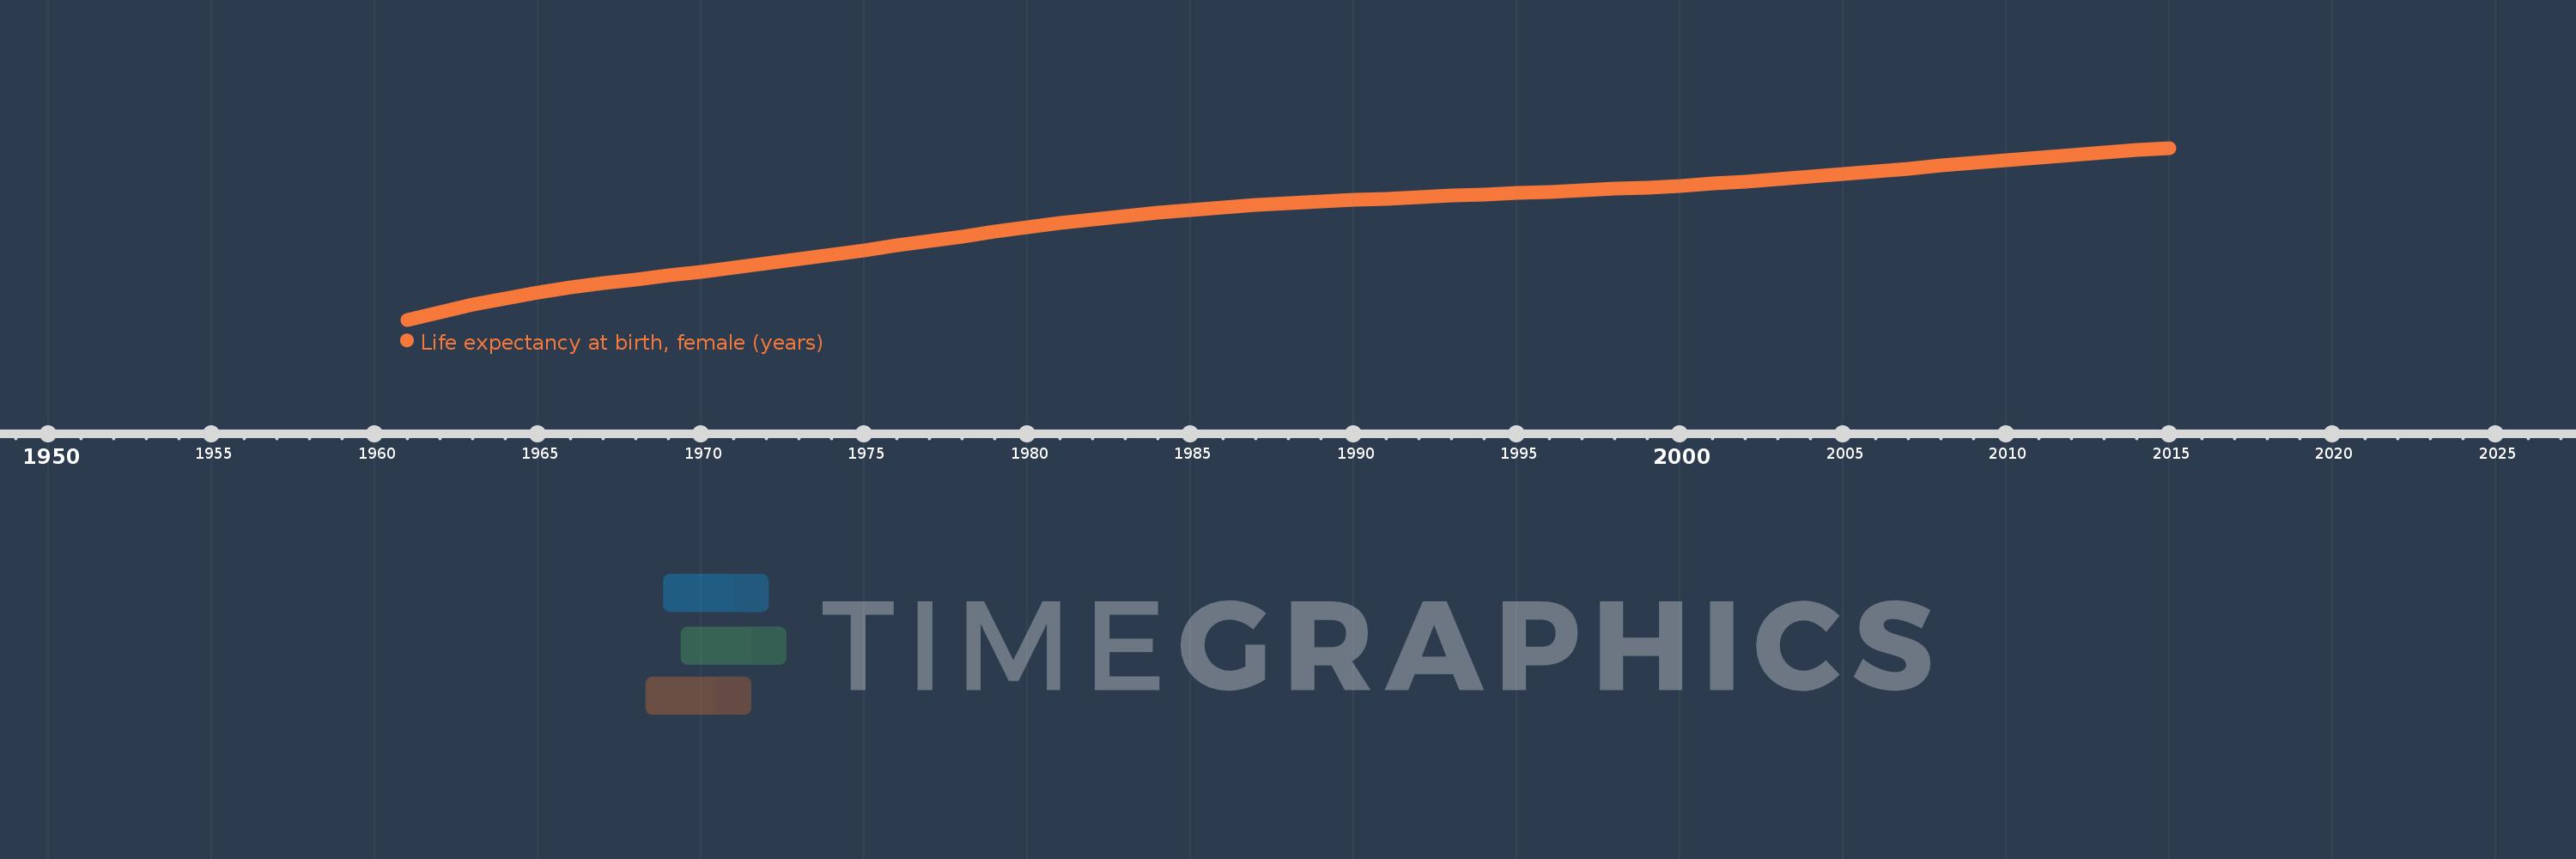
Life expectancy at birth, female (years)
2015,2014,2013,2012,2011,2010,2009,2008,2007,2006,2005,2004,2003,2002,2001,2000,1999,1998,1997,1996,1995,1994,1993,1992,1991,1990,1989,1988,1987,1986,1985,1984,1983,1982,1981,1980,1979,1978,1977,1976,1975,1974,1973,1972,1971,1970,1969,1968,1967,1966,1965,1964,1963,1962,1961
Queste statistiche in altri paesi:
AfghanistanAlbaniaAlgeriaAngolaAntigua and BarbudaArab WorldArgentinaArmeniaArubaAustraliaAustriaAzerbaijanBahamas, TheBahrainBangladeshBarbadosBelarusBelgiumBelizeBeninBermudaBhutanBoliviaBosnia and HerzegovinaBotswanaBrazilBrunei DarussalamBulgariaBurkina FasoBurundiCabo VerdeCambodiaCameroonCanadaCaribbean small statesCentral African RepublicCentral Europe and the BalticsChadChannel IslandsChileChinaColombiaComorosCongo, Dem. Rep.Congo, Rep.Costa RicaCote d'IvoireCroatiaCubaCuracaoCyprusCzech RepublicDenmarkDjiboutiDominicaDominican RepublicEarly-demographic dividendEast Asia & PacificEast Asia & Pacific (excluding high income)East Asia & Pacific (IDA & IBRD countries)EcuadorEgypt, Arab Rep.El SalvadorEquatorial GuineaEritreaEstoniaEthiopiaEuro areaEurope & Central AsiaEurope & Central Asia (excluding high income)Europe & Central Asia (IDA & IBRD countries)European UnionFaroe IslandsFijiFinlandFragile and conflict affected situationsFranceFrench PolynesiaGabonGambia, TheGeorgiaGermanyGhanaGreeceGreenlandGrenadaGuamGuatemalaGuineaGuinea-BissauGuyanaHaitiHeavily indebted poor countries (HIPC)High incomeHondurasHong Kong SAR, ChinaHungaryIBRD onlyIcelandIDA & IBRD totalIDA blendIDA onlyIDA totalIndiaIndonesiaIran, Islamic Rep.IraqIrelandIsle of ManIsraelItalyJamaicaJapanJordanKazakhstanKenyaKiribatiKorea, Dem. People’s Rep.Korea, Rep.KosovoKuwaitKyrgyz RepublicLao PDRLate-demographic dividendLatin America & Caribbean Latin America & Caribbean (excluding high income)Latin America & the Caribbean (IDA & IBRD countries)LatviaLeast developed countries: UN classificationLebanonLesothoLiberiaLibyaLiechtensteinLithuaniaLow & middle incomeLow incomeLower middle incomeLuxembourgMacao SAR, ChinaMacedonia, FYRMadagascarMalawiMalaysiaMaldivesMaliMaltaMarshall IslandsMauritaniaMauritiusMexicoMicronesia, Fed. Sts.Middle East & North AfricaMiddle East & North Africa (excluding high income)Middle East & North Africa (IDA & IBRD countries)Middle incomeMoldovaMongoliaMontenegroMoroccoMozambiqueMyanmarNamibiaNepalNetherlandsNew CaledoniaNew ZealandNicaraguaNigerNigeriaNorth AmericaNorwayOECD membersOmanOther small statesPacific island small statesPakistanPalauPanamaPapua New GuineaParaguayPeruPhilippinesPolandPortugalPost-demographic dividendPre-demographic dividendPuerto RicoQatarRomaniaRussian FederationRwandaSamoaSan MarinoSao Tome and PrincipeSaudi ArabiaSenegalSerbiaSeychellesSierra LeoneSingaporeSint Maarten (Dutch part)Slovak RepublicSloveniaSmall statesSolomon IslandsSomaliaSouth AfricaSouth AsiaSouth Asia (IDA & IBRD)South SudanSpainSri LankaSt. Kitts and NevisSt. LuciaSt. Martin (French part)St. Vincent and the GrenadinesSub-Saharan Africa Sub-Saharan Africa (excluding high income)Sub-Saharan Africa (IDA & IBRD countries)SudanSurinameSwazilandSwedenSwitzerlandSyrian Arab RepublicTajikistanTanzaniaThailandTimor-LesteTogoTongaTrinidad and TobagoTunisiaTurkeyTurkmenistanUgandaUkraineUnited Arab EmiratesUnited KingdomUnited StatesUpper middle incomeUruguayUzbekistanVanuatuVenezuela, RBVietnamVirgin Islands (U.S.)West Bank and GazaWorldYemen, Rep.ZambiaZimbabwe Linea del tempo:
Questa scala temporale mostra un grafico dal 1961 anno al 2015 anno. Caribbean small states. I dati fino ad 1960 anno non disponibili. Il numero di osservazioni attuali secondo i date: 55.
La fonte (nome):
Indicatori dello sviluppo mondiale
La fonte (organizzazione):
(1) United Nations Population Division. World Population Prospects, (2) Census reports and other statistical publications from national statistical offices, (3) Eurostat: Demographic Statistics, (4) United Nations Statistical Division. Population and Vital Statistics Reprot (various years), (5) U.S. Census Bureau: International Database, and (6) Secretariat of the Pacific Community: Statistics and Demography Programme.
Categorie:
Health, Gender, Social Development
sono stati aggiornati
23 apr 2017 anni
Indicatori delle variazioni dei valori per anni
Minima:
64.248
1 gen 1961 anni
Massimo:
75.652
1 gen 2015 anni
Alla data di osservazione
Valore
Variazione assoluta
La variazione rispetto al valore precedente
1 gen 1961 anni
64.248
+64.248
0.0%
1 gen 1962 anni
64.768
+0.52
0.81%
1 gen 1963 anni
65.241
+0.474
0.73%
1 gen 1964 anni
65.665
+0.424
0.65%
1 gen 1965 anni
66.041
+0.376
0.57%
1 gen 1966 anni
66.372
+0.331
0.5%
1 gen 1967 anni
66.665
+0.294
0.44%
1 gen 1968 anni
66.934
+0.269
0.4%
1 gen 1969 anni
67.191
+0.257
0.38%
1 gen 1970 anni
67.448
+0.256
0.38%
1 gen 1971 anni
67.711
+0.264
0.39%
1 gen 1972 anni
67.987
+0.275
0.41%
1 gen 1973 anni
68.274
+0.287
0.42%
1 gen 1974 anni
68.568
+0.294
0.43%
1 gen 1975 anni
68.869
+0.3
0.44%
1 gen 1976 anni
69.173
+0.304
0.44%
1 gen 1977 anni
69.48
+0.307
0.44%
1 gen 1978 anni
69.784
+0.305
0.44%
1 gen 1979 anni
70.083
+0.299
0.43%
1 gen 1980 anni
70.375
+0.292
0.42%
1 gen 1981 anni
70.655
+0.28
0.4%
1 gen 1982 anni
70.914
+0.259
0.37%
1 gen 1983 anni
71.153
+0.239
0.34%
1 gen 1984 anni
71.367
+0.214
0.3%
1 gen 1985 anni
71.554
+0.187
0.26%
1 gen 1986 anni
71.714
+0.159
0.22%
1 gen 1987 anni
71.851
+0.137
0.19%
1 gen 1988 anni
71.972
+0.121
0.17%
1 gen 1989 anni
72.082
+0.11
0.15%
1 gen 1990 anni
72.192
+0.11
0.15%
1 gen 1991 anni
72.296
+0.104
0.14%
1 gen 1992 anni
72.395
+0.099
0.14%
1 gen 1993 anni
72.488
+0.093
0.13%
1 gen 1994 anni
72.576
+0.088
0.12%
1 gen 1995 anni
72.663
+0.086
0.12%
1 gen 1996 anni
72.75
+0.087
0.12%
1 gen 1997 anni
72.842
+0.093
0.13%
1 gen 1998 anni
72.938
+0.095
0.13%
1 gen 1999 anni
73.04
+0.102
0.14%
1 gen 2000 anni
73.151
+0.11
0.15%
1 gen 2001 anni
73.273
+0.122
0.17%
1 gen 2002 anni
73.411
+0.138
0.19%
1 gen 2003 anni
73.562
+0.151
0.21%
1 gen 2004 anni
73.726
+0.164
0.22%
1 gen 2005 anni
73.901
+0.175
0.24%
1 gen 2006 anni
74.085
+0.184
0.25%
1 gen 2007 anni
74.275
+0.19
0.26%
1 gen 2008 anni
74.468
+0.192
0.26%
1 gen 2009 anni
74.66
+0.192
0.26%
1 gen 2010 anni
74.847
+0.187
0.25%
1 gen 2011 anni
75.027
+0.18
0.24%
1 gen 2012 anni
75.197
+0.17
0.23%
1 gen 2013 anni
75.357
+0.16
0.21%
1 gen 2014 anni
75.509
+0.152
0.2%
1 gen 2015 anni
75.652
+0.143
0.19%
Classificazione dei paesi secondo i statistiche attuali per anni


Commenti: