29
/it/
it
AIzaSyAYiBZKx7MnpbEhh9jyipgxe19OcubqV5w
April 1, 2024
45670
Low & middle income
LMY
false
2
1
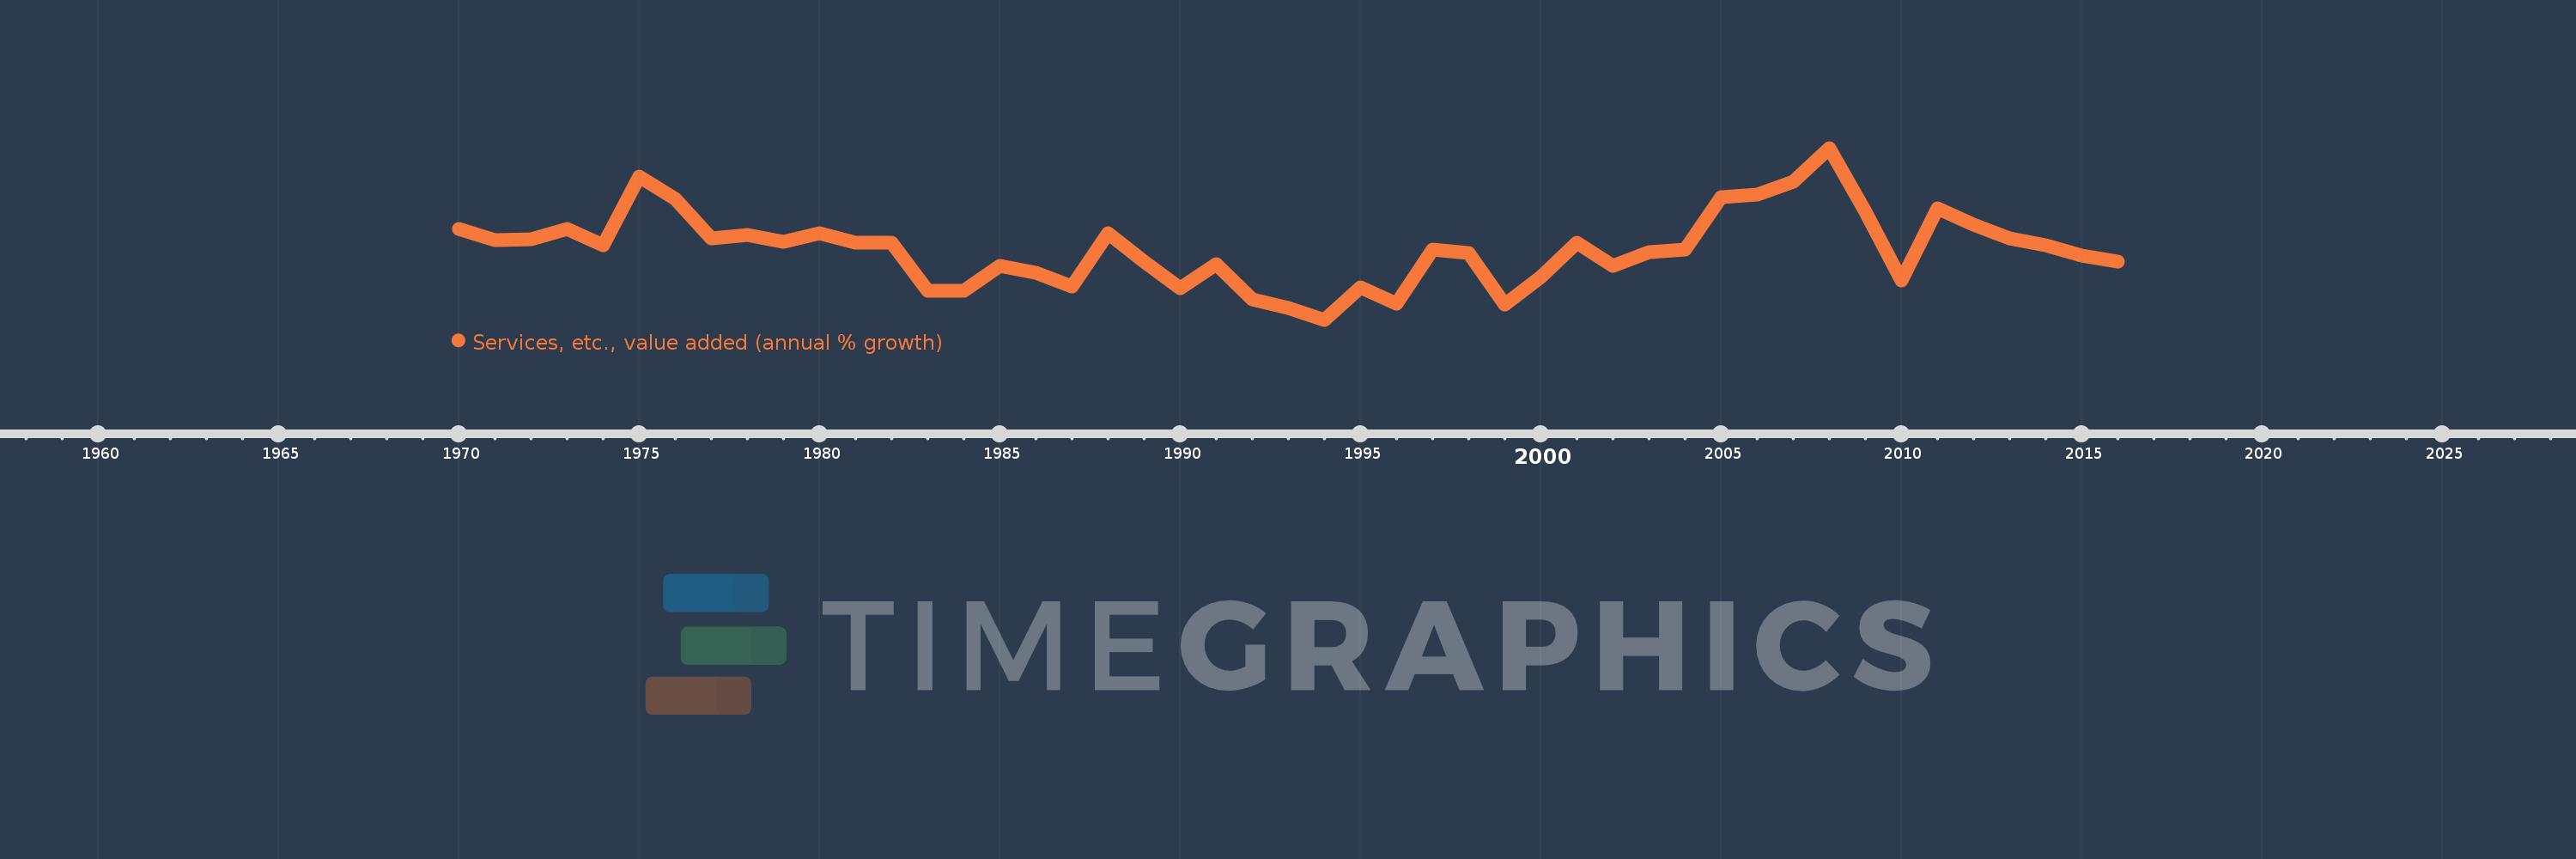
Services, etc., value added (annual % growth)
2016,2015,2014,2013,2012,2011,2010,2009,2008,2007,2006,2005,2004,2003,2002,2001,2000,1999,1998,1997,1996,1995,1994,1993,1992,1991,1990,1989,1988,1987,1986,1985,1984,1983,1982,1981,1980,1979,1978,1977,1976,1975,1974,1973,1972,1971,1970
Queste statistiche in altri paesi:
AfghanistanAlbaniaAlgeriaAntigua and BarbudaArab WorldArgentinaArmeniaAustraliaAustriaAzerbaijanBahamas, TheBahrainBangladeshBelarusBelgiumBelizeBeninBermudaBhutanBoliviaBosnia and HerzegovinaBotswanaBrazilBrunei DarussalamBulgariaBurkina FasoBurundiCabo VerdeCambodiaCameroonCanadaCaribbean small statesCentral African RepublicCentral Europe and the BalticsChadChileChinaColombiaComorosCongo, Dem. Rep.Congo, Rep.Costa RicaCote d'IvoireCroatiaCubaCyprusCzech RepublicDenmarkDjiboutiDominicaDominican RepublicEarly-demographic dividendEast Asia & PacificEast Asia & Pacific (excluding high income)East Asia & Pacific (IDA & IBRD countries)EcuadorEgypt, Arab Rep.El SalvadorEquatorial GuineaEritreaEstoniaEthiopiaEuro areaEurope & Central AsiaEurope & Central Asia (excluding high income)Europe & Central Asia (IDA & IBRD countries)European UnionFijiFinlandFragile and conflict affected situationsFranceGabonGambia, TheGeorgiaGermanyGhanaGreeceGrenadaGuatemalaGuineaGuinea-BissauGuyanaHaitiHeavily indebted poor countries (HIPC)High incomeHondurasHong Kong SAR, ChinaHungaryIBRD onlyIcelandIDA & IBRD totalIDA blendIDA onlyIDA totalIndiaIndonesiaIran, Islamic Rep.IraqIrelandItalyJamaicaJapanJordanKazakhstanKenyaKiribatiKorea, Rep.KosovoKuwaitKyrgyz RepublicLao PDRLate-demographic dividendLatin America & Caribbean Latin America & Caribbean (excluding high income)Latin America & the Caribbean (IDA & IBRD countries)LatviaLeast developed countries: UN classificationLebanonLesothoLiberiaLithuaniaLow & middle incomeLow incomeLower middle incomeLuxembourgMacedonia, FYRMadagascarMalawiMalaysiaMaldivesMaliMarshall IslandsMauritaniaMauritiusMexicoMicronesia, Fed. Sts.Middle East & North AfricaMiddle East & North Africa (excluding high income)Middle East & North Africa (IDA & IBRD countries)Middle incomeMoldovaMongoliaMontenegroMoroccoMozambiqueMyanmarNamibiaNepalNetherlandsNew ZealandNicaraguaNigerNigeriaNorth AmericaNorwayOECD membersOmanOther small statesPacific island small statesPakistanPalauPanamaPapua New GuineaParaguayPeruPhilippinesPolandPortugalPost-demographic dividendPre-demographic dividendPuerto RicoQatarRomaniaRussian FederationRwandaSamoaSao Tome and PrincipeSaudi ArabiaSenegalSerbiaSeychellesSierra LeoneSingaporeSlovak RepublicSloveniaSmall statesSolomon IslandsSomaliaSouth AfricaSouth AsiaSouth Asia (IDA & IBRD)SpainSri LankaSt. Kitts and NevisSt. LuciaSt. Vincent and the GrenadinesSub-Saharan Africa Sub-Saharan Africa (excluding high income)Sub-Saharan Africa (IDA & IBRD countries)SudanSurinameSwazilandSwedenSwitzerlandSyrian Arab RepublicTajikistanTanzaniaThailandTimor-LesteTogoTongaTrinidad and TobagoTunisiaTurkeyTurkmenistanTuvaluUgandaUkraineUnited Arab EmiratesUnited KingdomUnited StatesUpper middle incomeUruguayUzbekistanVanuatuVenezuela, RBVietnamWest Bank and GazaWorldZambiaZimbabwe Linea del tempo:
Questa scala temporale mostra un grafico dal 1970 anno al 2016 anno. Low & middle income. I dati fino ad 1969 anno non disponibili. Il numero di osservazioni attuali secondo i date: 47.
La fonte (nome):
Indicatori dello sviluppo mondiale
La fonte (organizzazione):
World Bank national accounts data, and OECD National Accounts data files.
Categorie:
Economy & Growth
sono stati aggiornati
23 apr 2017 anni
Indicatori delle variazioni dei valori per anni
Minima:
1.403
1 gen 1994 anni
Massimo:
10.209
1 gen 2008 anni
Alla data di osservazione
Valore
Variazione assoluta
La variazione rispetto al valore precedente
1 gen 1970 anni
6.043
+6.043
0.0%
1 gen 1971 anni
5.474
-0.569
-9.41%
1 gen 1972 anni
5.546
+0.072
1.31%
1 gen 1973 anni
6.037
+0.491
8.85%
1 gen 1974 anni
5.199
-0.838
-13.88%
1 gen 1975 anni
8.721
+3.523
67.76%
1 gen 1976 anni
7.587
-1.134
-13.0%
1 gen 1977 anni
5.563
-2.024
-26.68%
1 gen 1978 anni
5.745
+0.182
3.26%
1 gen 1979 anni
5.403
-0.342
-5.95%
1 gen 1980 anni
5.831
+0.428
7.92%
1 gen 1981 anni
5.354
-0.477
-8.18%
1 gen 1982 anni
5.343
-0.011
-0.21%
1 gen 1983 anni
2.899
-2.444
-45.74%
1 gen 1984 anni
2.872
-0.027
-0.92%
1 gen 1985 anni
4.167
+1.295
45.07%
1 gen 1986 anni
3.801
-0.366
-8.78%
1 gen 1987 anni
3.126
-0.675
-17.76%
1 gen 1988 anni
5.854
+2.728
87.29%
1 gen 1989 anni
4.37
-1.484
-25.36%
1 gen 1990 anni
3.017
-1.353
-30.96%
1 gen 1991 anni
4.236
+1.219
40.42%
1 gen 1992 anni
2.428
-1.808
-42.68%
1 gen 1993 anni
2.026
-0.402
-16.57%
1 gen 1994 anni
1.403
-0.623
-30.77%
1 gen 1995 anni
3.066
+1.664
118.63%
1 gen 1996 anni
2.209
-0.857
-27.96%
1 gen 1997 anni
5.01
+2.801
126.81%
1 gen 1998 anni
4.837
-0.174
-3.47%
1 gen 1999 anni
2.174
-2.663
-55.06%
1 gen 2000 anni
3.598
+1.425
65.54%
1 gen 2001 anni
5.368
+1.77
49.18%
1 gen 2002 anni
4.161
-1.207
-22.48%
1 gen 2003 anni
4.856
+0.695
16.71%
1 gen 2004 anni
4.999
+0.143
2.94%
1 gen 2005 anni
7.678
+2.679
53.58%
1 gen 2006 anni
7.81
+0.132
1.73%
1 gen 2007 anni
8.496
+0.686
8.78%
1 gen 2008 anni
10.209
+1.713
20.16%
1 gen 2009 anni
6.942
-3.267
-32.0%
1 gen 2010 anni
3.432
-3.51
-50.56%
1 gen 2011 anni
7.108
+3.676
107.1%
1 gen 2012 anni
6.278
-0.83
-11.68%
1 gen 2013 anni
5.579
-0.7
-11.15%
1 gen 2014 anni
5.24
-0.338
-6.07%
1 gen 2015 anni
4.676
-0.564
-10.77%
1 gen 2016 anni
4.382
-0.294
-6.28%
Classificazione dei paesi secondo i statistiche attuali per anni


Commenti: