29
/it/
it
AIzaSyAYiBZKx7MnpbEhh9jyipgxe19OcubqV5w
April 1, 2024
196277
Mexico
MEX
true
2
1
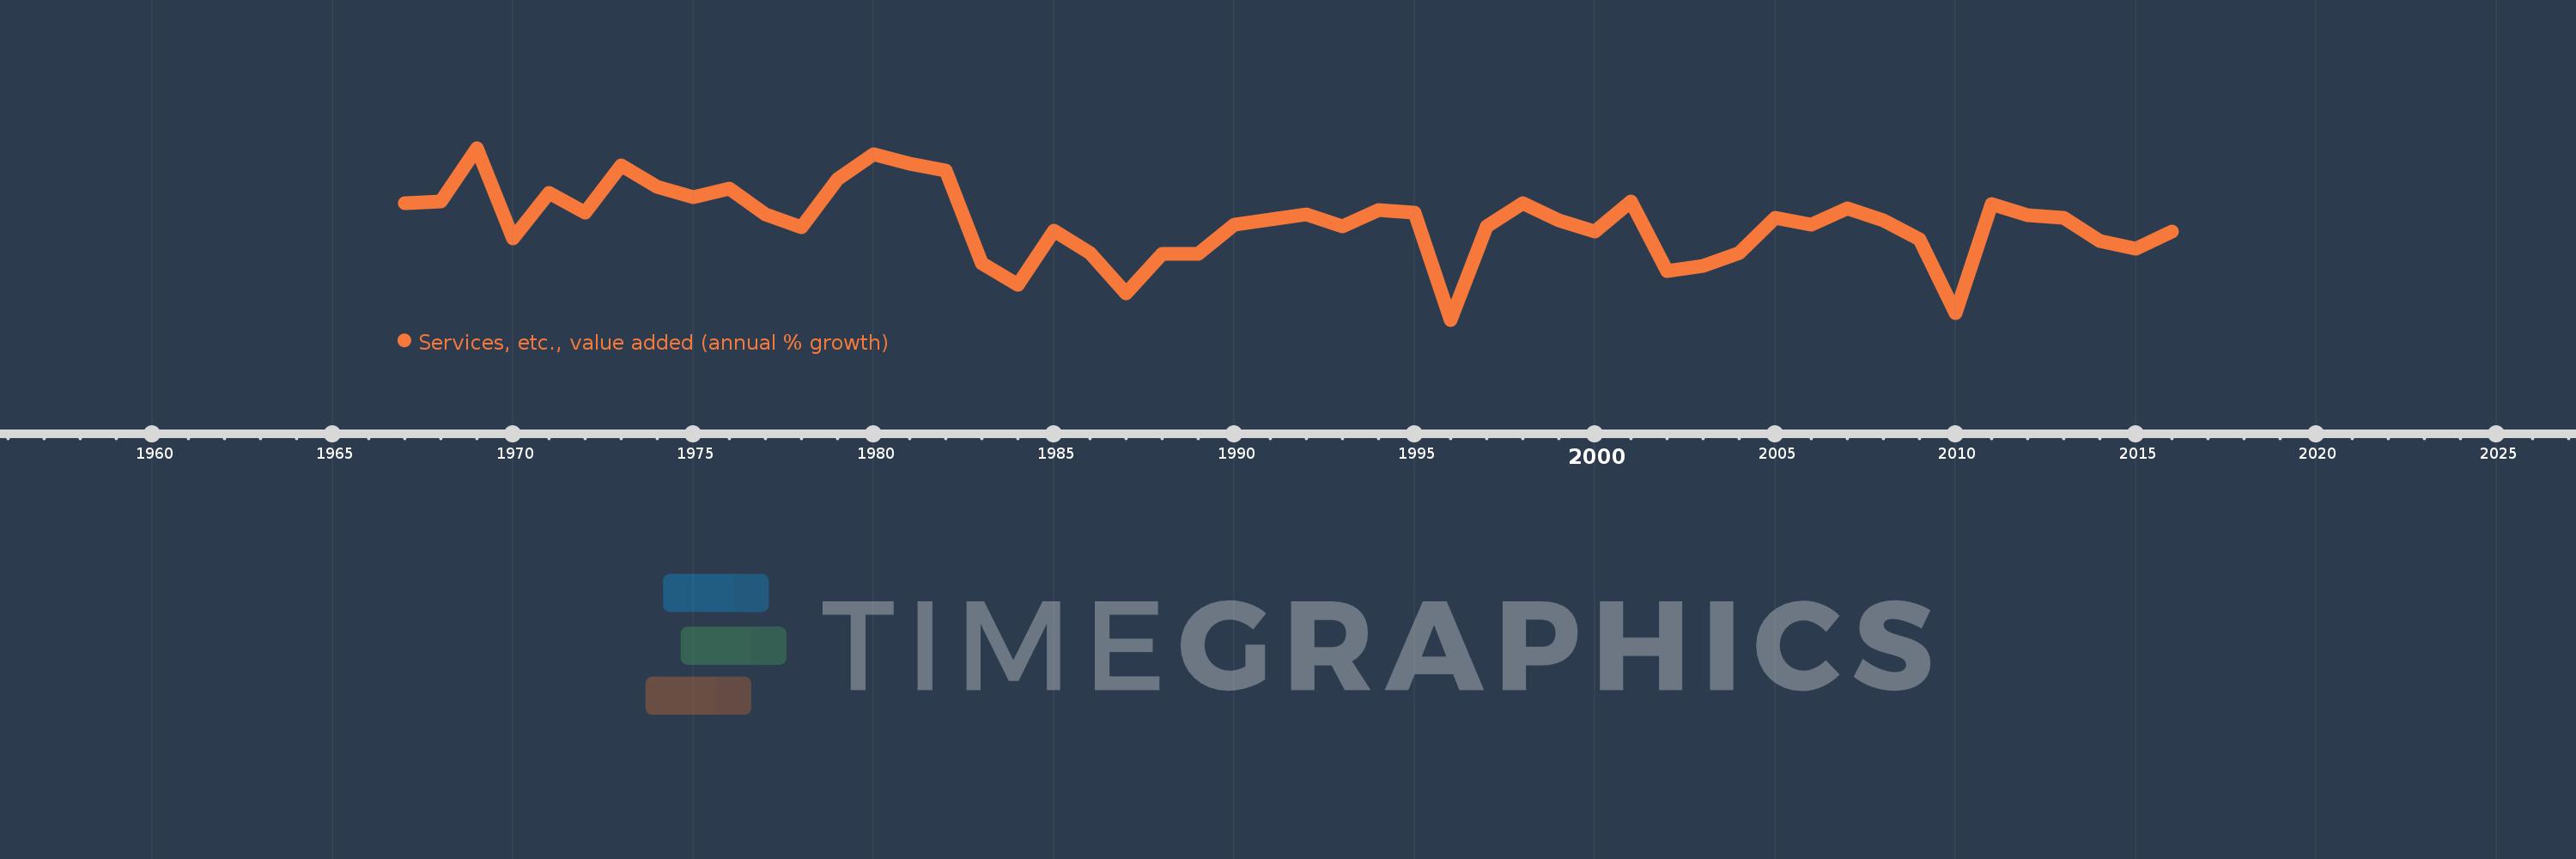
Services, etc., value added (annual % growth)
2016,2015,2014,2013,2012,2011,2010,2009,2008,2007,2006,2005,2004,2003,2002,2001,2000,1999,1998,1997,1996,1995,1994,1993,1992,1991,1990,1989,1988,1987,1986,1985,1984,1983,1982,1981,1980,1979,1978,1977,1976,1975,1974,1973,1972,1971,1970,1969,1968,1967
Queste statistiche in altri paesi:
AfghanistanAlbaniaAlgeriaAntigua and BarbudaArab WorldArgentinaArmeniaAustraliaAustriaAzerbaijanBahamas, TheBahrainBangladeshBelarusBelgiumBelizeBeninBermudaBhutanBoliviaBosnia and HerzegovinaBotswanaBrazilBrunei DarussalamBulgariaBurkina FasoBurundiCabo VerdeCambodiaCameroonCanadaCaribbean small statesCentral African RepublicCentral Europe and the BalticsChadChileChinaColombiaComorosCongo, Dem. Rep.Congo, Rep.Costa RicaCote d'IvoireCroatiaCubaCyprusCzech RepublicDenmarkDjiboutiDominicaDominican RepublicEarly-demographic dividendEast Asia & PacificEast Asia & Pacific (excluding high income)East Asia & Pacific (IDA & IBRD countries)EcuadorEgypt, Arab Rep.El SalvadorEquatorial GuineaEritreaEstoniaEthiopiaEuro areaEurope & Central AsiaEurope & Central Asia (excluding high income)Europe & Central Asia (IDA & IBRD countries)European UnionFijiFinlandFragile and conflict affected situationsFranceGabonGambia, TheGeorgiaGermanyGhanaGreeceGrenadaGuatemalaGuineaGuinea-BissauGuyanaHaitiHeavily indebted poor countries (HIPC)High incomeHondurasHong Kong SAR, ChinaHungaryIBRD onlyIcelandIDA & IBRD totalIDA blendIDA onlyIDA totalIndiaIndonesiaIran, Islamic Rep.IraqIrelandItalyJamaicaJapanJordanKazakhstanKenyaKiribatiKorea, Rep.KosovoKuwaitKyrgyz RepublicLao PDRLate-demographic dividendLatin America & Caribbean Latin America & Caribbean (excluding high income)Latin America & the Caribbean (IDA & IBRD countries)LatviaLeast developed countries: UN classificationLebanonLesothoLiberiaLithuaniaLow & middle incomeLow incomeLower middle incomeLuxembourgMacedonia, FYRMadagascarMalawiMalaysiaMaldivesMaliMarshall IslandsMauritaniaMauritiusMexicoMicronesia, Fed. Sts.Middle East & North AfricaMiddle East & North Africa (excluding high income)Middle East & North Africa (IDA & IBRD countries)Middle incomeMoldovaMongoliaMontenegroMoroccoMozambiqueMyanmarNamibiaNepalNetherlandsNew ZealandNicaraguaNigerNigeriaNorth AmericaNorwayOECD membersOmanOther small statesPacific island small statesPakistanPalauPanamaPapua New GuineaParaguayPeruPhilippinesPolandPortugalPost-demographic dividendPre-demographic dividendPuerto RicoQatarRomaniaRussian FederationRwandaSamoaSao Tome and PrincipeSaudi ArabiaSenegalSerbiaSeychellesSierra LeoneSingaporeSlovak RepublicSloveniaSmall statesSolomon IslandsSomaliaSouth AfricaSouth AsiaSouth Asia (IDA & IBRD)SpainSri LankaSt. Kitts and NevisSt. LuciaSt. Vincent and the GrenadinesSub-Saharan Africa Sub-Saharan Africa (excluding high income)Sub-Saharan Africa (IDA & IBRD countries)SudanSurinameSwazilandSwedenSwitzerlandSyrian Arab RepublicTajikistanTanzaniaThailandTimor-LesteTogoTongaTrinidad and TobagoTunisiaTurkeyTurkmenistanTuvaluUgandaUkraineUnited Arab EmiratesUnited KingdomUnited StatesUpper middle incomeUruguayUzbekistanVanuatuVenezuela, RBVietnamWest Bank and GazaWorldZambiaZimbabwe Linea del tempo:
Questa scala temporale mostra un grafico dal 1967 anno al 2016 anno. Mexico. I dati fino ad 1966 anno non disponibili. Il numero di osservazioni attuali secondo i date: 50.
La fonte (nome):
Indicatori dello sviluppo mondiale
La fonte (organizzazione):
World Bank national accounts data, and OECD National Accounts data files.
Categorie:
Economy & Growth
sono stati aggiornati
23 apr 2017 anni
Indicatori delle variazioni dei valori per anni
Minima:
-4.475
1 gen 1996 anni
Massimo:
10.644
1 gen 1969 anni
Alla data di osservazione
Valore
Variazione assoluta
La variazione rispetto al valore precedente
1 gen 1967 anni
5.821
+5.821
0.0%
1 gen 1968 anni
5.916
+0.094
1.62%
1 gen 1969 anni
10.644
+4.729
79.93%
1 gen 1970 anni
2.648
-7.996
-75.12%
1 gen 1971 anni
6.666
+4.018
151.72%
1 gen 1972 anni
4.979
-1.687
-25.3%
1 gen 1973 anni
9.081
+4.102
82.37%
1 gen 1974 anni
7.254
-1.827
-20.12%
1 gen 1975 anni
6.306
-0.948
-13.06%
1 gen 1976 anni
7.036
+0.73
11.57%
1 gen 1977 anni
4.814
-2.222
-31.58%
1 gen 1978 anni
3.673
-1.141
-23.7%
1 gen 1979 anni
7.935
+4.262
116.04%
1 gen 1980 anni
10.067
+2.133
26.88%
1 gen 1981 anni
9.24
-0.827
-8.22%
1 gen 1982 anni
8.659
-0.581
-6.29%
1 gen 1983 anni
0.519
-8.139
-94.0%
1 gen 1984 anni
-1.381
-1.9
-365.82%
1 gen 1985 anni
3.356
+4.736
-343.03%
1 gen 1986 anni
1.384
-1.971
-58.75%
1 gen 1987 anni
-2.16
-3.544
-256.04%
1 gen 1988 anni
1.346
+3.506
-162.31%
1 gen 1989 anni
1.292
-0.054
-4.02%
1 gen 1990 anni
3.879
+2.587
200.3%
1 gen 1991 anni
4.348
+0.469
12.08%
1 gen 1992 anni
4.769
+0.421
9.68%
1 gen 1993 anni
3.776
-0.993
-20.82%
1 gen 1994 anni
5.174
+1.398
37.03%
1 gen 1995 anni
4.958
-0.216
-4.18%
1 gen 1996 anni
-4.475
-9.433
-190.25%
1 gen 1997 anni
3.751
+8.226
-183.83%
1 gen 1998 anni
5.818
+2.066
55.09%
1 gen 1999 anni
4.294
-1.523
-26.19%
1 gen 2000 anni
3.322
-0.972
-22.63%
1 gen 2001 anni
5.918
+2.596
78.14%
1 gen 2002 anni
-0.205
-6.123
-103.46%
1 gen 2003 anni
0.242
+0.447
-218.12%
1 gen 2004 anni
1.391
+1.149
474.68%
1 gen 2005 anni
4.467
+3.076
221.1%
1 gen 2006 anni
3.883
-0.584
-13.08%
1 gen 2007 anni
5.314
+1.431
36.85%
1 gen 2008 anni
4.286
-1.028
-19.34%
1 gen 2009 anni
2.572
-1.714
-39.99%
1 gen 2010 anni
-3.901
-6.474
-251.68%
1 gen 2011 anni
5.675
+9.577
-245.46%
1 gen 2012 anni
4.745
-0.93
-16.39%
1 gen 2013 anni
4.517
-0.228
-4.8%
1 gen 2014 anni
2.442
-2.075
-45.93%
1 gen 2015 anni
1.798
-0.644
-26.39%
1 gen 2016 anni
3.308
+1.51
83.97%
Classificazione dei paesi secondo i statistiche attuali per anni


Commenti: