29
/it/
it
AIzaSyAYiBZKx7MnpbEhh9jyipgxe19OcubqV5w
April 1, 2024
270061
Turkey
TUR
true
2
1
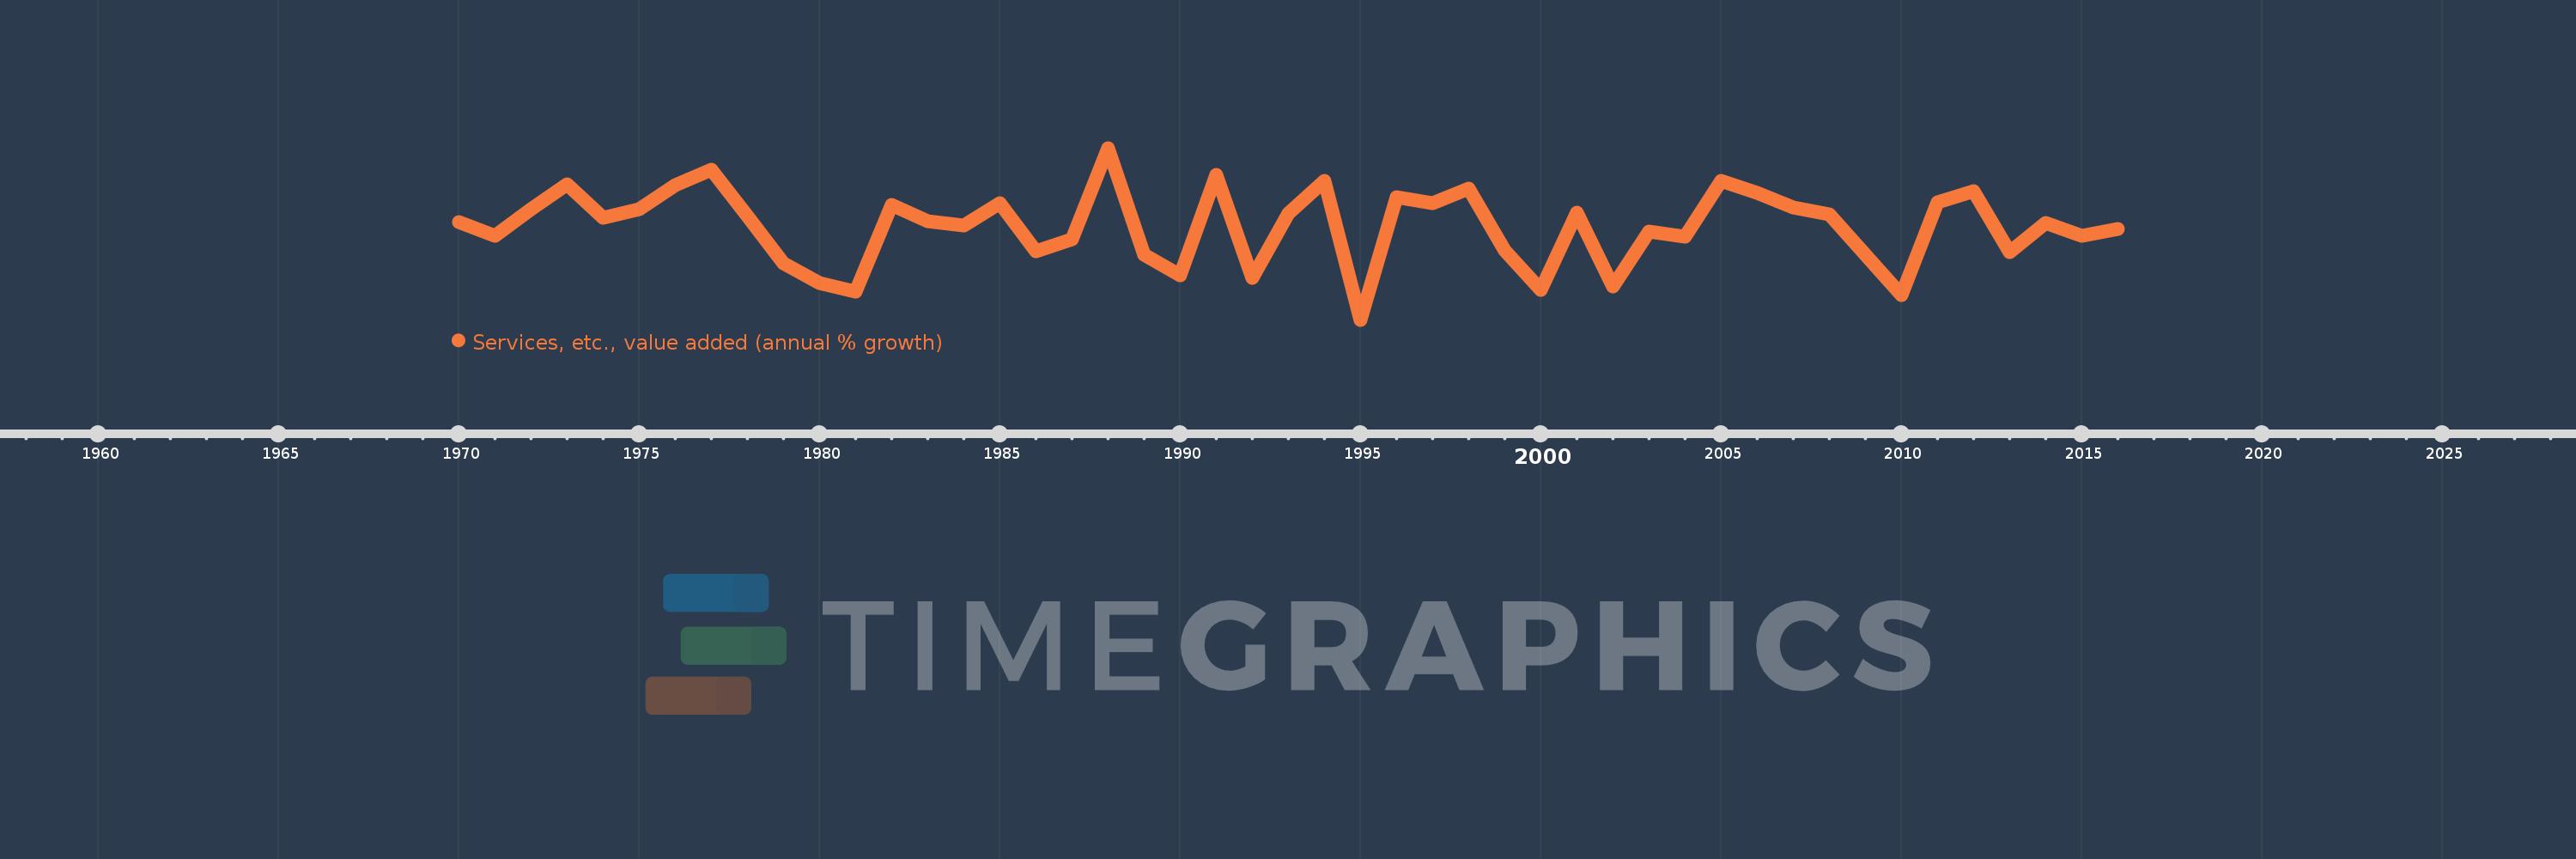
Services, etc., value added (annual % growth)
2016,2015,2014,2013,2012,2011,2010,2009,2008,2007,2006,2005,2004,2003,2002,2001,2000,1999,1998,1997,1996,1995,1994,1993,1992,1991,1990,1989,1988,1987,1986,1985,1984,1983,1982,1981,1980,1979,1978,1977,1976,1975,1974,1973,1972,1971,1970
Queste statistiche in altri paesi:
AfghanistanAlbaniaAlgeriaAntigua and BarbudaArab WorldArgentinaArmeniaAustraliaAustriaAzerbaijanBahamas, TheBahrainBangladeshBelarusBelgiumBelizeBeninBermudaBhutanBoliviaBosnia and HerzegovinaBotswanaBrazilBrunei DarussalamBulgariaBurkina FasoBurundiCabo VerdeCambodiaCameroonCanadaCaribbean small statesCentral African RepublicCentral Europe and the BalticsChadChileChinaColombiaComorosCongo, Dem. Rep.Congo, Rep.Costa RicaCote d'IvoireCroatiaCubaCyprusCzech RepublicDenmarkDjiboutiDominicaDominican RepublicEarly-demographic dividendEast Asia & PacificEast Asia & Pacific (excluding high income)East Asia & Pacific (IDA & IBRD countries)EcuadorEgypt, Arab Rep.El SalvadorEquatorial GuineaEritreaEstoniaEthiopiaEuro areaEurope & Central AsiaEurope & Central Asia (excluding high income)Europe & Central Asia (IDA & IBRD countries)European UnionFijiFinlandFragile and conflict affected situationsFranceGabonGambia, TheGeorgiaGermanyGhanaGreeceGrenadaGuatemalaGuineaGuinea-BissauGuyanaHaitiHeavily indebted poor countries (HIPC)High incomeHondurasHong Kong SAR, ChinaHungaryIBRD onlyIcelandIDA & IBRD totalIDA blendIDA onlyIDA totalIndiaIndonesiaIran, Islamic Rep.IraqIrelandItalyJamaicaJapanJordanKazakhstanKenyaKiribatiKorea, Rep.KosovoKuwaitKyrgyz RepublicLao PDRLate-demographic dividendLatin America & Caribbean Latin America & Caribbean (excluding high income)Latin America & the Caribbean (IDA & IBRD countries)LatviaLeast developed countries: UN classificationLebanonLesothoLiberiaLithuaniaLow & middle incomeLow incomeLower middle incomeLuxembourgMacedonia, FYRMadagascarMalawiMalaysiaMaldivesMaliMarshall IslandsMauritaniaMauritiusMexicoMicronesia, Fed. Sts.Middle East & North AfricaMiddle East & North Africa (excluding high income)Middle East & North Africa (IDA & IBRD countries)Middle incomeMoldovaMongoliaMontenegroMoroccoMozambiqueMyanmarNamibiaNepalNetherlandsNew ZealandNicaraguaNigerNigeriaNorth AmericaNorwayOECD membersOmanOther small statesPacific island small statesPakistanPalauPanamaPapua New GuineaParaguayPeruPhilippinesPolandPortugalPost-demographic dividendPre-demographic dividendPuerto RicoQatarRomaniaRussian FederationRwandaSamoaSao Tome and PrincipeSaudi ArabiaSenegalSerbiaSeychellesSierra LeoneSingaporeSlovak RepublicSloveniaSmall statesSolomon IslandsSomaliaSouth AfricaSouth AsiaSouth Asia (IDA & IBRD)SpainSri LankaSt. Kitts and NevisSt. LuciaSt. Vincent and the GrenadinesSub-Saharan Africa Sub-Saharan Africa (excluding high income)Sub-Saharan Africa (IDA & IBRD countries)SudanSurinameSwazilandSwedenSwitzerlandSyrian Arab RepublicTajikistanTanzaniaThailandTimor-LesteTogoTongaTrinidad and TobagoTunisiaTurkeyTurkmenistanTuvaluUgandaUkraineUnited Arab EmiratesUnited KingdomUnited StatesUpper middle incomeUruguayUzbekistanVanuatuVenezuela, RBVietnamWest Bank and GazaWorldZambiaZimbabwe Linea del tempo:
Questa scala temporale mostra un grafico dal 1970 anno al 2016 anno. Turkey. I dati fino ad 1969 anno non disponibili. Il numero di osservazioni attuali secondo i date: 47.
La fonte (nome):
Indicatori dello sviluppo mondiale
La fonte (organizzazione):
World Bank national accounts data, and OECD National Accounts data files.
Categorie:
Economy & Growth
sono stati aggiornati
23 apr 2017 anni
Indicatori delle variazioni dei valori per anni
Minima:
-4.34
1 gen 1995 anni
Massimo:
13.183
1 gen 1988 anni
Alla data di osservazione
Valore
Variazione assoluta
La variazione rispetto al valore precedente
1 gen 1970 anni
5.604
+5.604
0.0%
1 gen 1971 anni
4.263
-1.341
-23.92%
1 gen 1972 anni
6.948
+2.685
62.98%
1 gen 1973 anni
9.435
+2.487
35.79%
1 gen 1974 anni
6.101
-3.333
-35.33%
1 gen 1975 anni
6.898
+0.797
13.07%
1 gen 1976 anni
9.356
+2.458
35.63%
1 gen 1977 anni
10.954
+1.597
17.07%
1 gen 1978 anni
6.211
-4.742
-43.29%
1 gen 1979 anni
1.424
-4.788
-77.08%
1 gen 1980 anni
-0.623
-2.046
-143.75%
1 gen 1981 anni
-1.474
-0.852
136.73%
1 gen 1982 anni
7.413
+8.888
-602.79%
1 gen 1983 anni
5.716
-1.698
-22.9%
1 gen 1984 anni
5.268
-0.447
-7.83%
1 gen 1985 anni
7.519
+2.25
42.72%
1 gen 1986 anni
2.614
-4.904
-65.23%
1 gen 1987 anni
3.854
+1.24
47.44%
1 gen 1988 anni
13.183
+9.329
242.03%
1 gen 1989 anni
2.301
-10.882
-82.55%
1 gen 1990 anni
0.207
-2.094
-91.01%
1 gen 1991 anni
10.42
+10.214
4.94 Mille.%
1 gen 1992 anni
-0.05
-10.47
-100.48%
1 gen 1993 anni
6.466
+6.516
-13.08 Mille.%
1 gen 1994 anni
9.802
+3.336
51.6%
1 gen 1995 anni
-4.34
-14.142
-144.27%
1 gen 1996 anni
8.142
+12.482
-287.62%
1 gen 1997 anni
7.54
-0.602
-7.39%
1 gen 1998 anni
9.048
+1.507
19.99%
1 gen 1999 anni
2.729
-6.319
-69.84%
1 gen 2000 anni
-1.28
-4.009
-146.9%
1 gen 2001 anni
6.612
+7.892
-616.59%
1 gen 2002 anni
-0.963
-7.576
-114.57%
1 gen 2003 anni
4.676
+5.639
-585.43%
1 gen 2004 anni
4.13
-0.546
-11.67%
1 gen 2005 anni
9.843
+5.713
138.32%
1 gen 2006 anni
8.573
-1.27
-12.9%
1 gen 2007 anni
7.093
-1.48
-17.26%
1 gen 2008 anni
6.386
-0.707
-9.97%
1 gen 2009 anni
2.306
-4.08
-63.89%
1 gen 2010 anni
-1.813
-4.12
-178.63%
1 gen 2011 anni
7.637
+9.45
-521.13%
1 gen 2012 anni
8.759
+1.122
14.69%
1 gen 2013 anni
2.549
-6.21
-70.9%
1 gen 2014 anni
5.542
+2.993
117.44%
1 gen 2015 anni
4.253
-1.289
-23.26%
1 gen 2016 anni
4.883
+0.63
14.82%
Classificazione dei paesi secondo i statistiche attuali per anni


Commenti: