29
/it/
it
AIzaSyAYiBZKx7MnpbEhh9jyipgxe19OcubqV5w
April 1, 2024
131171
Ethiopia
ETH
true
2
1
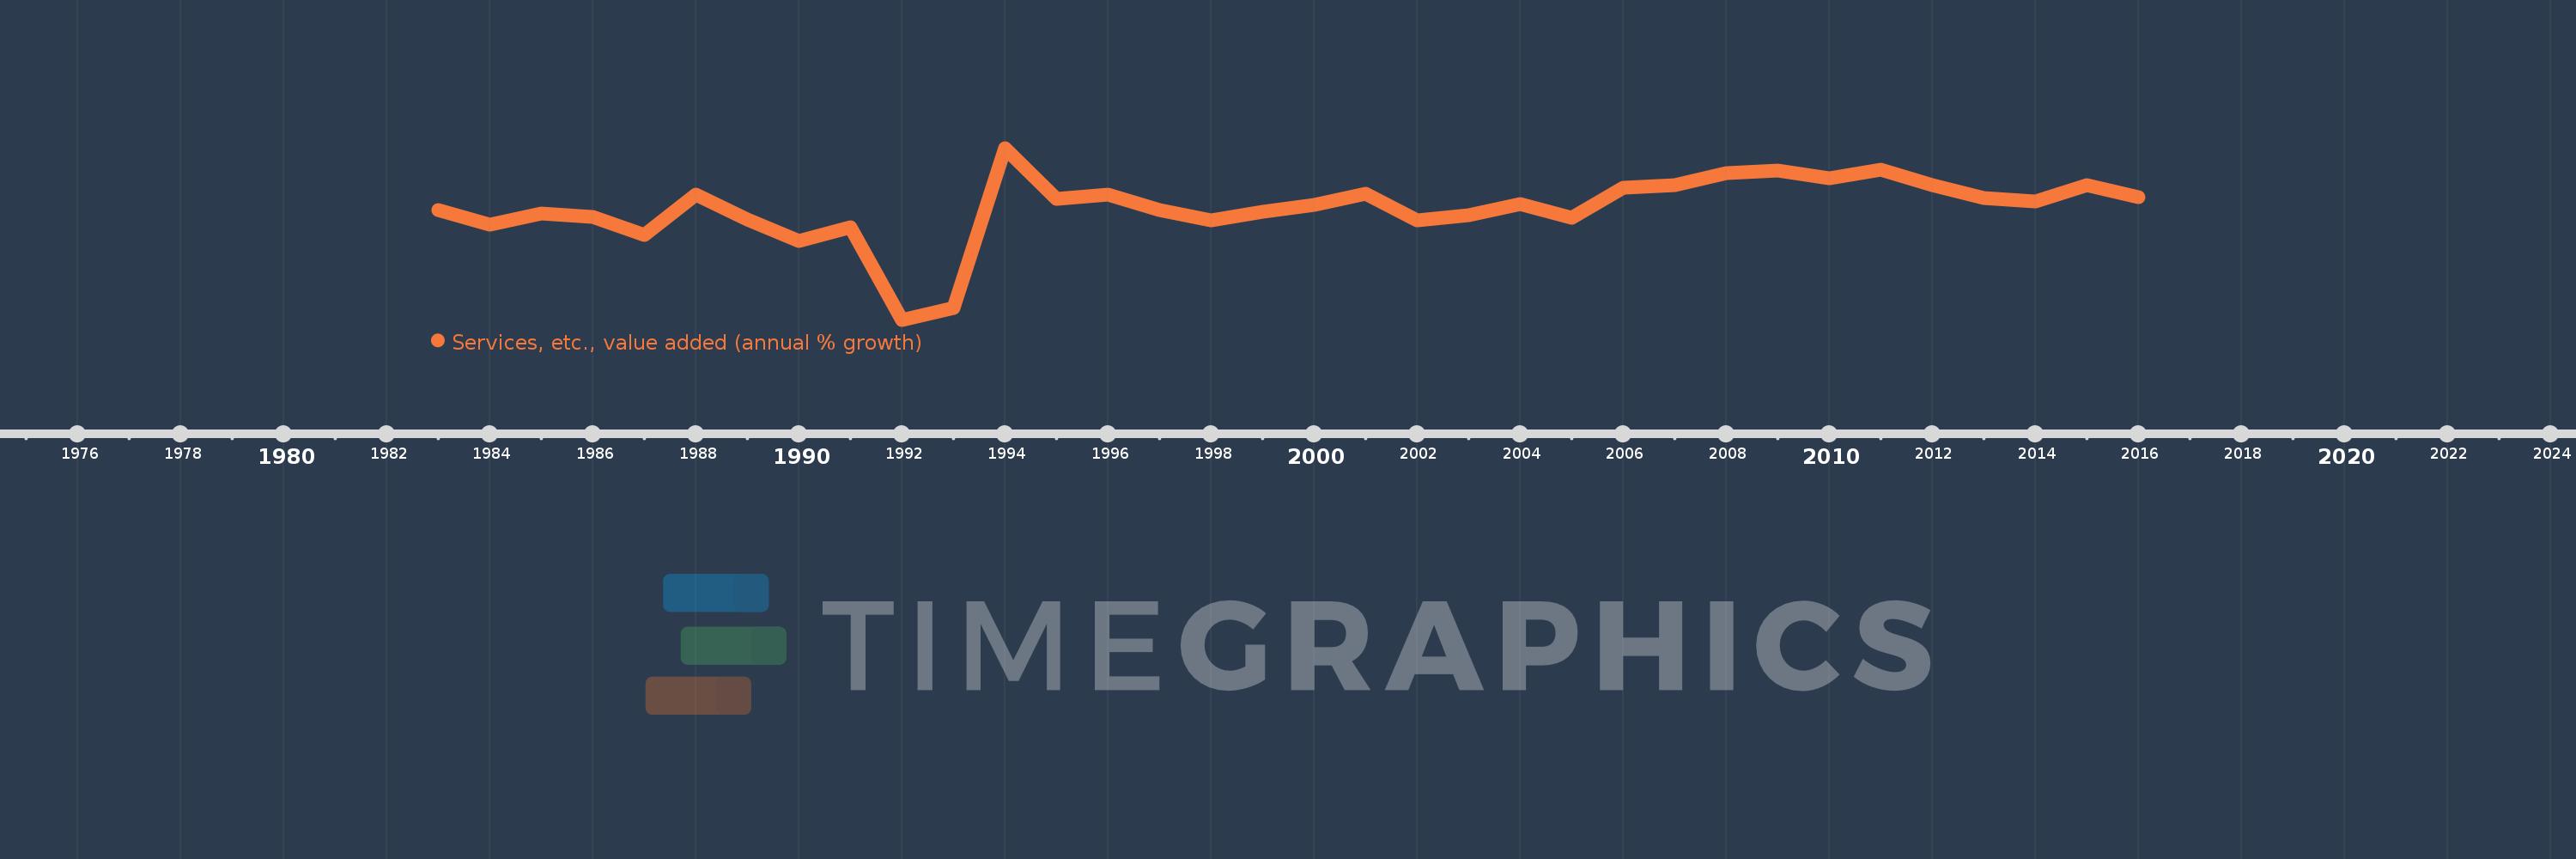
Services, etc., value added (annual % growth)
2016,2015,2014,2013,2012,2011,2010,2009,2008,2007,2006,2005,2004,2003,2002,2001,2000,1999,1998,1997,1996,1995,1994,1993,1992,1991,1990,1989,1988,1987,1986,1985,1984,1983
Queste statistiche in altri paesi:
AfghanistanAlbaniaAlgeriaAntigua and BarbudaArab WorldArgentinaArmeniaAustraliaAustriaAzerbaijanBahamas, TheBahrainBangladeshBelarusBelgiumBelizeBeninBermudaBhutanBoliviaBosnia and HerzegovinaBotswanaBrazilBrunei DarussalamBulgariaBurkina FasoBurundiCabo VerdeCambodiaCameroonCanadaCaribbean small statesCentral African RepublicCentral Europe and the BalticsChadChileChinaColombiaComorosCongo, Dem. Rep.Congo, Rep.Costa RicaCote d'IvoireCroatiaCubaCyprusCzech RepublicDenmarkDjiboutiDominicaDominican RepublicEarly-demographic dividendEast Asia & PacificEast Asia & Pacific (excluding high income)East Asia & Pacific (IDA & IBRD countries)EcuadorEgypt, Arab Rep.El SalvadorEquatorial GuineaEritreaEstoniaEthiopiaEuro areaEurope & Central AsiaEurope & Central Asia (excluding high income)Europe & Central Asia (IDA & IBRD countries)European UnionFijiFinlandFragile and conflict affected situationsFranceGabonGambia, TheGeorgiaGermanyGhanaGreeceGrenadaGuatemalaGuineaGuinea-BissauGuyanaHaitiHeavily indebted poor countries (HIPC)High incomeHondurasHong Kong SAR, ChinaHungaryIBRD onlyIcelandIDA & IBRD totalIDA blendIDA onlyIDA totalIndiaIndonesiaIran, Islamic Rep.IraqIrelandItalyJamaicaJapanJordanKazakhstanKenyaKiribatiKorea, Rep.KosovoKuwaitKyrgyz RepublicLao PDRLate-demographic dividendLatin America & Caribbean Latin America & Caribbean (excluding high income)Latin America & the Caribbean (IDA & IBRD countries)LatviaLeast developed countries: UN classificationLebanonLesothoLiberiaLithuaniaLow & middle incomeLow incomeLower middle incomeLuxembourgMacedonia, FYRMadagascarMalawiMalaysiaMaldivesMaliMarshall IslandsMauritaniaMauritiusMexicoMicronesia, Fed. Sts.Middle East & North AfricaMiddle East & North Africa (excluding high income)Middle East & North Africa (IDA & IBRD countries)Middle incomeMoldovaMongoliaMontenegroMoroccoMozambiqueMyanmarNamibiaNepalNetherlandsNew ZealandNicaraguaNigerNigeriaNorth AmericaNorwayOECD membersOmanOther small statesPacific island small statesPakistanPalauPanamaPapua New GuineaParaguayPeruPhilippinesPolandPortugalPost-demographic dividendPre-demographic dividendPuerto RicoQatarRomaniaRussian FederationRwandaSamoaSao Tome and PrincipeSaudi ArabiaSenegalSerbiaSeychellesSierra LeoneSingaporeSlovak RepublicSloveniaSmall statesSolomon IslandsSomaliaSouth AfricaSouth AsiaSouth Asia (IDA & IBRD)SpainSri LankaSt. Kitts and NevisSt. LuciaSt. Vincent and the GrenadinesSub-Saharan Africa Sub-Saharan Africa (excluding high income)Sub-Saharan Africa (IDA & IBRD countries)SudanSurinameSwazilandSwedenSwitzerlandSyrian Arab RepublicTajikistanTanzaniaThailandTimor-LesteTogoTongaTrinidad and TobagoTunisiaTurkeyTurkmenistanTuvaluUgandaUkraineUnited Arab EmiratesUnited KingdomUnited StatesUpper middle incomeUruguayUzbekistanVanuatuVenezuela, RBVietnamWest Bank and GazaWorldZambiaZimbabwe Linea del tempo:
Questa scala temporale mostra un grafico dal 1983 anno al 2016 anno. Ethiopia. I dati fino ad 1982 anno non disponibili. Il numero di osservazioni attuali secondo i date: 34.
La fonte (nome):
Indicatori dello sviluppo mondiale
La fonte (organizzazione):
World Bank national accounts data, and OECD National Accounts data files.
Categorie:
Economy & Growth
sono stati aggiornati
23 apr 2017 anni
Indicatori delle variazioni dei valori per anni
Minima:
-19.46
1 gen 1992 anni
Massimo:
21.876
1 gen 1994 anni
Alla data di osservazione
Valore
Variazione assoluta
La variazione rispetto al valore precedente
1 gen 1983 anni
6.885
+6.885
0.0%
1 gen 1984 anni
3.406
-3.478
-50.52%
1 gen 1985 anni
6.132
+2.726
80.01%
1 gen 1986 anni
5.359
-0.773
-12.6%
1 gen 1987 anni
0.912
-4.448
-82.99%
1 gen 1988 anni
10.681
+9.77
1.07 Mille.%
1 gen 1989 anni
4.575
-6.106
-57.17%
1 gen 1990 anni
-0.569
-5.144
-112.43%
1 gen 1991 anni
2.748
+3.317
-583.21%
1 gen 1992 anni
-19.46
-22.208
-808.12%
1 gen 1993 anni
-16.72
+2.74
-14.08%
1 gen 1994 anni
21.876
+38.597
-230.84%
1 gen 1995 anni
9.631
-12.246
-55.98%
1 gen 1996 anni
10.586
+0.955
9.92%
1 gen 1997 anni
6.993
-3.593
-33.94%
1 gen 1998 anni
4.397
-2.596
-37.13%
1 gen 1999 anni
6.484
+2.087
47.46%
1 gen 2000 anni
8.113
+1.63
25.13%
1 gen 2001 anni
10.884
+2.771
34.16%
1 gen 2002 anni
4.54
-6.344
-58.29%
1 gen 2003 anni
5.637
+1.097
24.16%
1 gen 2004 anni
8.468
+2.83
50.2%
1 gen 2005 anni
5.079
-3.388
-40.02%
1 gen 2006 anni
12.317
+7.238
142.5%
1 gen 2007 anni
12.845
+0.528
4.29%
1 gen 2008 anni
15.757
+2.912
22.67%
1 gen 2009 anni
16.4
+0.644
4.09%
1 gen 2010 anni
14.682
-1.718
-10.48%
1 gen 2011 anni
16.737
+2.055
14.0%
1 gen 2012 anni
13.002
-3.735
-22.32%
1 gen 2013 anni
9.909
-3.093
-23.79%
1 gen 2014 anni
9.05
-0.859
-8.66%
1 gen 2015 anni
12.915
+3.865
42.7%
1 gen 2016 anni
10.086
-2.829
-21.91%
Classificazione dei paesi secondo i statistiche attuali per anni


Commenti: