29
/it/
it
AIzaSyAYiBZKx7MnpbEhh9jyipgxe19OcubqV5w
April 1, 2024
43740
Latin America & the Caribbean (IDA & IBRD countries)
TLA
false
2
1
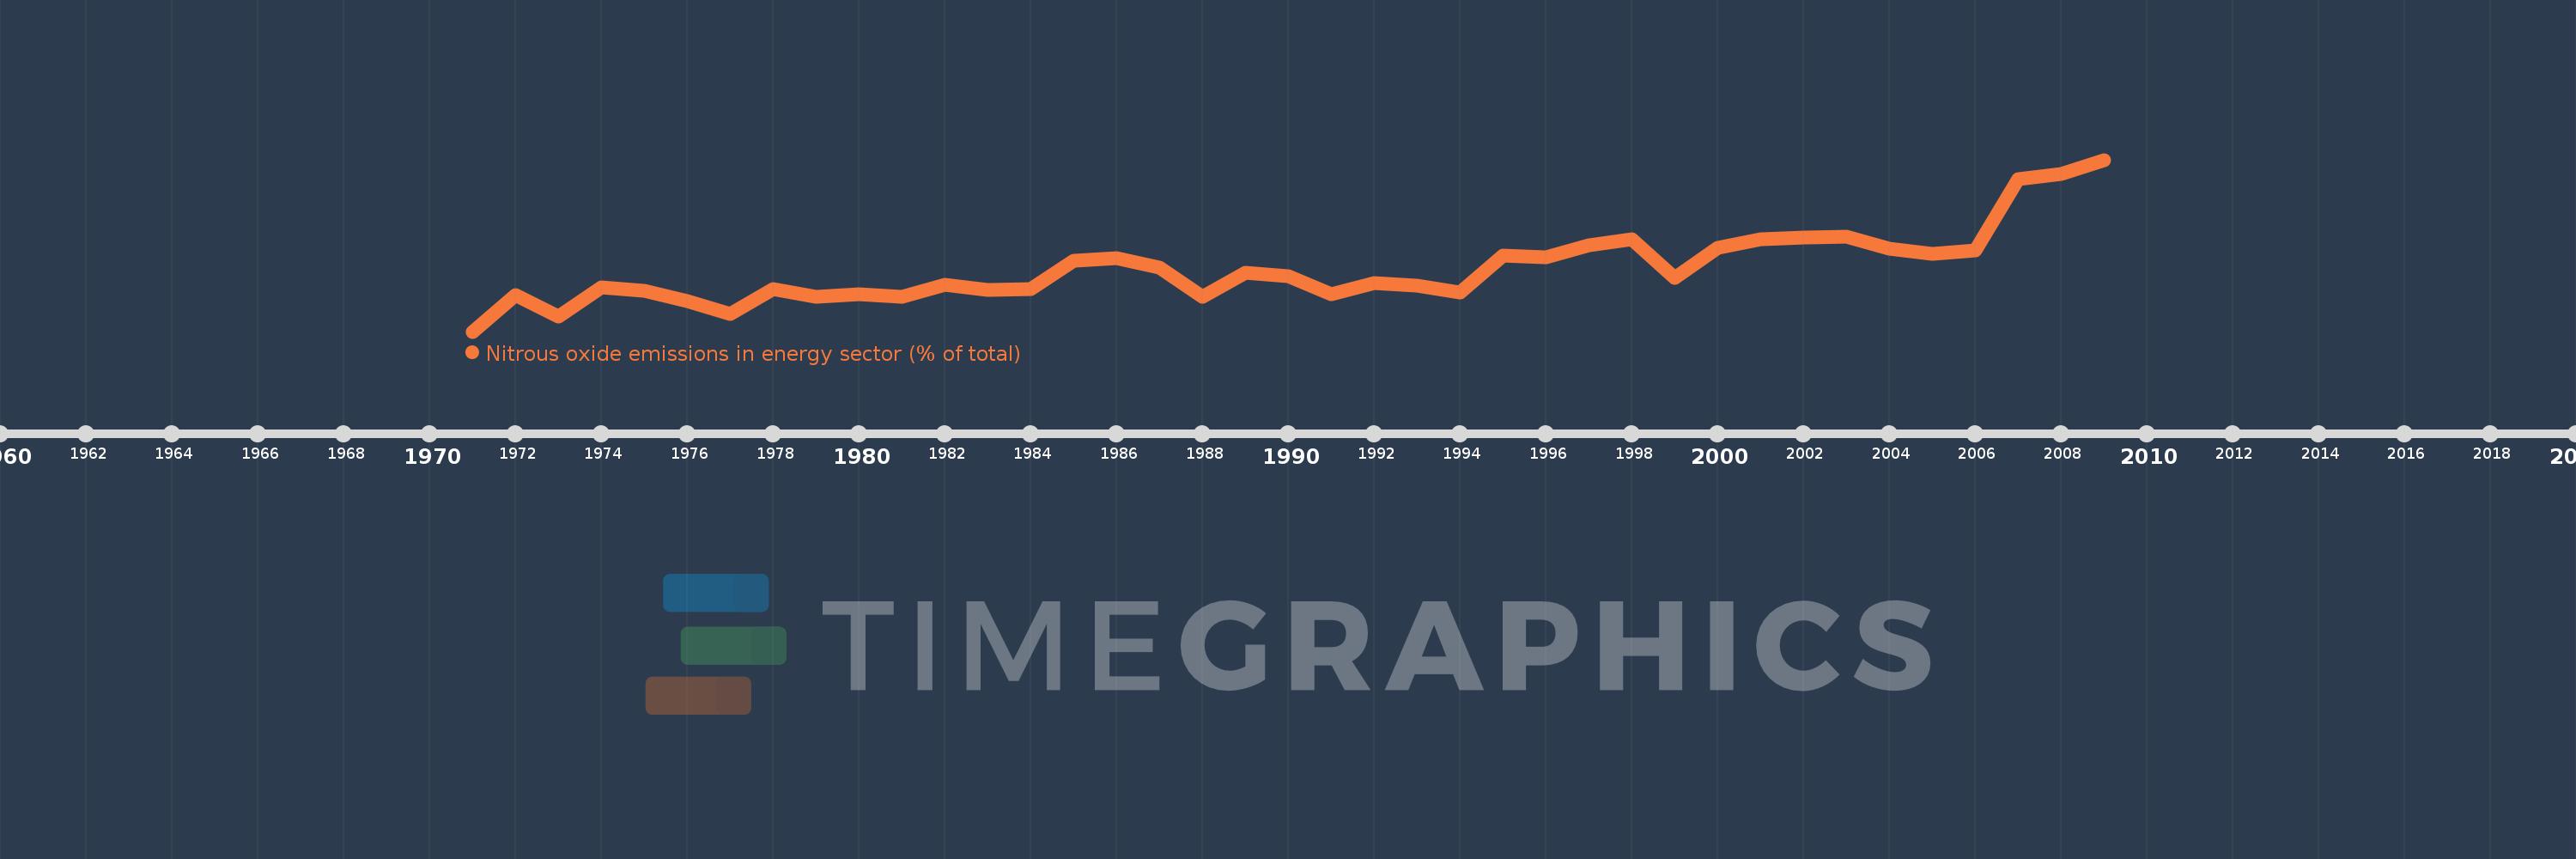
Nitrous oxide emissions in energy sector (% of total)
2009,2008,2007,2006,2005,2004,2003,2002,2001,2000,1999,1998,1997,1996,1995,1994,1993,1992,1991,1990,1989,1988,1987,1986,1985,1984,1983,1982,1981,1980,1979,1978,1977,1976,1975,1974,1973,1972,1971
Queste statistiche in altri paesi:
AfghanistanAlbaniaAlgeriaAmerican SamoaAndorraAngolaAntigua and BarbudaArab WorldArgentinaArmeniaArubaAustraliaAustriaAzerbaijanBahamas, TheBahrainBangladeshBarbadosBelarusBelgiumBelizeBeninBermudaBhutanBoliviaBosnia and HerzegovinaBotswanaBrazilBritish Virgin IslandsBrunei DarussalamBulgariaBurkina FasoBurundiCabo VerdeCambodiaCameroonCanadaCaribbean small statesCayman IslandsCentral African RepublicCentral Europe and the BalticsChadChileChinaColombiaComorosCongo, Dem. Rep.Congo, Rep.Costa RicaCote d'IvoireCroatiaCubaCyprusCzech RepublicDenmarkDjiboutiDominicaDominican RepublicEarly-demographic dividendEast Asia & PacificEast Asia & Pacific (excluding high income)East Asia & Pacific (IDA & IBRD countries)EcuadorEgypt, Arab Rep.El SalvadorEquatorial GuineaEritreaEstoniaEthiopiaEuro areaEurope & Central AsiaEurope & Central Asia (excluding high income)Europe & Central Asia (IDA & IBRD countries)European UnionFaroe IslandsFijiFinlandFragile and conflict affected situationsFranceFrench PolynesiaGabonGambia, TheGeorgiaGermanyGhanaGibraltarGreeceGreenlandGrenadaGuamGuatemalaGuineaGuinea-BissauGuyanaHaitiHeavily indebted poor countries (HIPC)High incomeHondurasHong Kong SAR, ChinaHungaryIBRD onlyIcelandIDA & IBRD totalIDA blendIDA onlyIDA totalIndiaIndonesiaIran, Islamic Rep.IraqIrelandIsraelItalyJamaicaJapanJordanKazakhstanKenyaKiribatiKorea, Dem. People’s Rep.Korea, Rep.KuwaitKyrgyz RepublicLao PDRLate-demographic dividendLatin America & Caribbean Latin America & Caribbean (excluding high income)Latin America & the Caribbean (IDA & IBRD countries)LatviaLeast developed countries: UN classificationLebanonLesothoLiberiaLibyaLithuaniaLow & middle incomeLow incomeLower middle incomeLuxembourgMacao SAR, ChinaMacedonia, FYRMadagascarMalawiMalaysiaMaldivesMaliMaltaMarshall IslandsMauritaniaMauritiusMexicoMicronesia, Fed. Sts.Middle East & North AfricaMiddle East & North Africa (excluding high income)Middle East & North Africa (IDA & IBRD countries)Middle incomeMoldovaMongoliaMoroccoMozambiqueMyanmarNamibiaNauruNepalNetherlandsNew CaledoniaNew ZealandNicaraguaNigerNigeriaNorth AmericaNorthern Mariana IslandsNorwayOECD membersOmanOther small statesPacific island small statesPakistanPalauPanamaPapua New GuineaParaguayPeruPhilippinesPolandPortugalPost-demographic dividendPre-demographic dividendPuerto RicoQatarRomaniaRussian FederationRwandaSamoaSao Tome and PrincipeSaudi ArabiaSenegalSerbiaSeychellesSierra LeoneSingaporeSlovak RepublicSloveniaSmall statesSolomon IslandsSomaliaSouth AfricaSouth AsiaSouth Asia (IDA & IBRD)SpainSri LankaSt. Kitts and NevisSt. LuciaSt. Vincent and the GrenadinesSub-Saharan Africa Sub-Saharan Africa (excluding high income)Sub-Saharan Africa (IDA & IBRD countries)SudanSurinameSwazilandSwedenSwitzerlandSyrian Arab RepublicTajikistanTanzaniaThailandTimor-LesteTogoTongaTrinidad and TobagoTunisiaTurkeyTurkmenistanTurks and Caicos IslandsTuvaluUgandaUkraineUnited Arab EmiratesUnited KingdomUnited StatesUpper middle incomeUruguayUzbekistanVanuatuVenezuela, RBVietnamVirgin Islands (U.S.)WorldYemen, Rep.ZambiaZimbabwe Linea del tempo:
Questa scala temporale mostra un grafico dal 1971 anno al 2009 anno. Latin America & the Caribbean (IDA & IBRD countries). I dati fino ad 1970 anno non disponibili. Il numero di osservazioni attuali secondo i date: 39.
La fonte (nome):
Indicatori dello sviluppo mondiale
La fonte (organizzazione):
World Bank staff estimates from original source: European Commission, Joint Research Centre (JRC)/Netherlands Environmental Assessment Agency (PBL). Emission Database for Global Atmospheric Research (EDGAR): http://edgar.jrc.ec.europa.eu/.
Categorie:
Energy & Mining, Environment
sono stati aggiornati
23 apr 2017 anni
Indicatori delle variazioni dei valori per anni
Minima:
2.592
1 gen 1971 anni
Massimo:
4.189
1 gen 2009 anni
Alla data di osservazione
Valore
Variazione assoluta
La variazione rispetto al valore precedente
1 gen 1971 anni
2.592
+2.592
0.0%
1 gen 1972 anni
2.928
+0.336
12.96%
1 gen 1973 anni
2.732
-0.196
-6.7%
1 gen 1974 anni
3.007
+0.275
10.05%
1 gen 1975 anni
2.971
-0.036
-1.2%
1 gen 1976 anni
2.877
-0.094
-3.16%
1 gen 1977 anni
2.753
-0.124
-4.3%
1 gen 1978 anni
2.991
+0.238
8.65%
1 gen 1979 anni
2.917
-0.074
-2.47%
1 gen 1980 anni
2.943
+0.026
0.87%
1 gen 1981 anni
2.914
-0.029
-1.0%
1 gen 1982 anni
3.03
+0.117
4.0%
1 gen 1983 anni
2.977
-0.053
-1.75%
1 gen 1984 anni
2.986
+0.008
0.28%
1 gen 1985 anni
3.25
+0.264
8.84%
1 gen 1986 anni
3.275
+0.025
0.78%
1 gen 1987 anni
3.183
-0.092
-2.81%
1 gen 1988 anni
2.919
-0.264
-8.29%
1 gen 1989 anni
3.14
+0.221
7.58%
1 gen 1990 anni
3.108
-0.032
-1.03%
1 gen 1991 anni
2.937
-0.17
-5.48%
1 gen 1992 anni
3.047
+0.109
3.73%
1 gen 1993 anni
3.017
-0.03
-0.99%
1 gen 1994 anni
2.953
-0.064
-2.12%
1 gen 1995 anni
3.302
+0.35
11.84%
1 gen 1996 anni
3.286
-0.016
-0.49%
1 gen 1997 anni
3.394
+0.108
3.29%
1 gen 1998 anni
3.449
+0.055
1.62%
1 gen 1999 anni
3.094
-0.355
-10.31%
1 gen 2000 anni
3.367
+0.273
8.84%
1 gen 2001 anni
3.453
+0.086
2.55%
1 gen 2002 anni
3.463
+0.01
0.29%
1 gen 2003 anni
3.472
+0.009
0.27%
1 gen 2004 anni
3.361
-0.112
-3.21%
1 gen 2005 anni
3.317
-0.044
-1.3%
1 gen 2006 anni
3.345
+0.028
0.85%
1 gen 2007 anni
4.01
+0.664
19.86%
1 gen 2008 anni
4.057
+0.047
1.18%
1 gen 2009 anni
4.189
+0.132
3.26%
Classificazione dei paesi secondo i statistiche attuali per anni


Commenti: