29
/it/
it
AIzaSyAYiBZKx7MnpbEhh9jyipgxe19OcubqV5w
April 1, 2024
233946
Sao Tome and Principe
STP
true
2
1
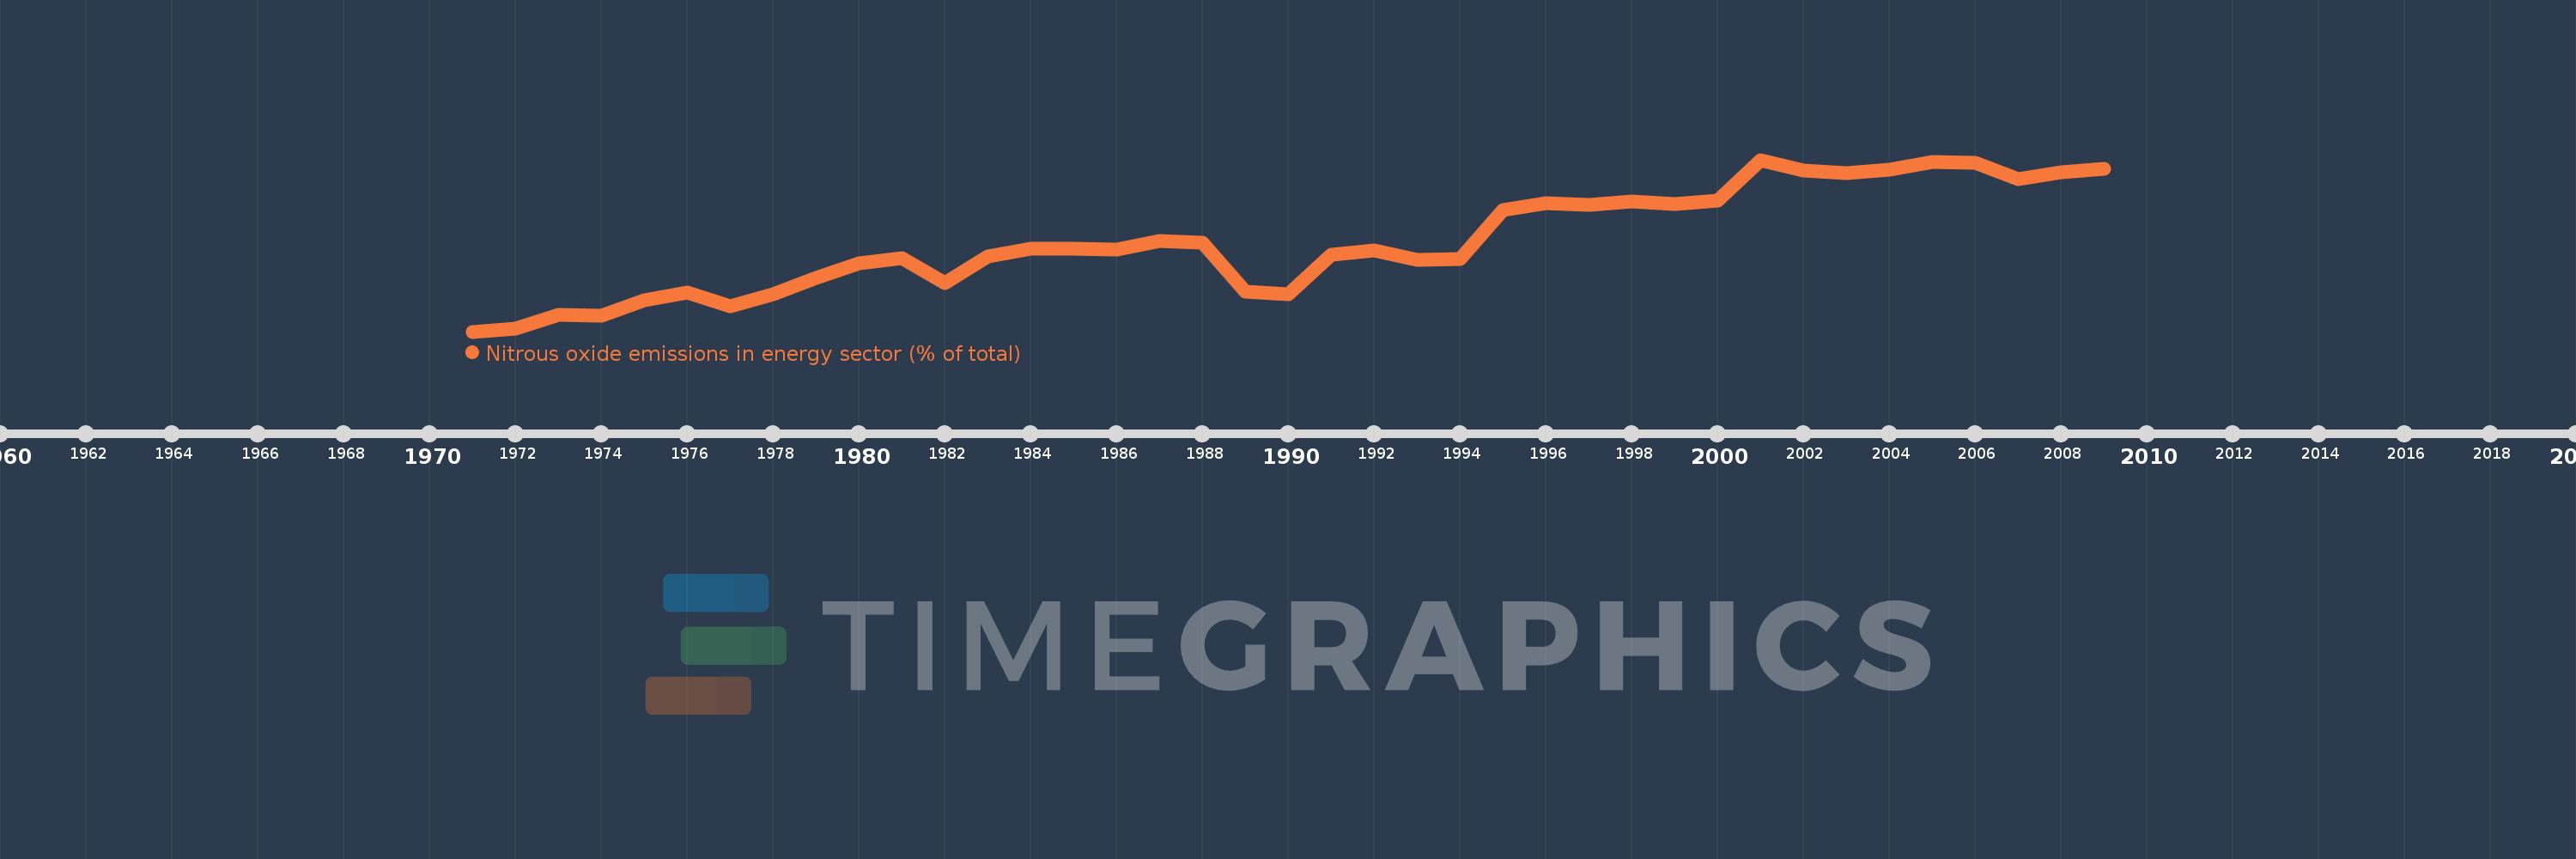
Nitrous oxide emissions in energy sector (% of total)
2009,2008,2007,2006,2005,2004,2003,2002,2001,2000,1999,1998,1997,1996,1995,1994,1993,1992,1991,1990,1989,1988,1987,1986,1985,1984,1983,1982,1981,1980,1979,1978,1977,1976,1975,1974,1973,1972,1971
Queste statistiche in altri paesi:
AfghanistanAlbaniaAlgeriaAmerican SamoaAndorraAngolaAntigua and BarbudaArab WorldArgentinaArmeniaArubaAustraliaAustriaAzerbaijanBahamas, TheBahrainBangladeshBarbadosBelarusBelgiumBelizeBeninBermudaBhutanBoliviaBosnia and HerzegovinaBotswanaBrazilBritish Virgin IslandsBrunei DarussalamBulgariaBurkina FasoBurundiCabo VerdeCambodiaCameroonCanadaCaribbean small statesCayman IslandsCentral African RepublicCentral Europe and the BalticsChadChileChinaColombiaComorosCongo, Dem. Rep.Congo, Rep.Costa RicaCote d'IvoireCroatiaCubaCyprusCzech RepublicDenmarkDjiboutiDominicaDominican RepublicEarly-demographic dividendEast Asia & PacificEast Asia & Pacific (excluding high income)East Asia & Pacific (IDA & IBRD countries)EcuadorEgypt, Arab Rep.El SalvadorEquatorial GuineaEritreaEstoniaEthiopiaEuro areaEurope & Central AsiaEurope & Central Asia (excluding high income)Europe & Central Asia (IDA & IBRD countries)European UnionFaroe IslandsFijiFinlandFragile and conflict affected situationsFranceFrench PolynesiaGabonGambia, TheGeorgiaGermanyGhanaGibraltarGreeceGreenlandGrenadaGuamGuatemalaGuineaGuinea-BissauGuyanaHaitiHeavily indebted poor countries (HIPC)High incomeHondurasHong Kong SAR, ChinaHungaryIBRD onlyIcelandIDA & IBRD totalIDA blendIDA onlyIDA totalIndiaIndonesiaIran, Islamic Rep.IraqIrelandIsraelItalyJamaicaJapanJordanKazakhstanKenyaKiribatiKorea, Dem. People’s Rep.Korea, Rep.KuwaitKyrgyz RepublicLao PDRLate-demographic dividendLatin America & Caribbean Latin America & Caribbean (excluding high income)Latin America & the Caribbean (IDA & IBRD countries)LatviaLeast developed countries: UN classificationLebanonLesothoLiberiaLibyaLithuaniaLow & middle incomeLow incomeLower middle incomeLuxembourgMacao SAR, ChinaMacedonia, FYRMadagascarMalawiMalaysiaMaldivesMaliMaltaMarshall IslandsMauritaniaMauritiusMexicoMicronesia, Fed. Sts.Middle East & North AfricaMiddle East & North Africa (excluding high income)Middle East & North Africa (IDA & IBRD countries)Middle incomeMoldovaMongoliaMoroccoMozambiqueMyanmarNamibiaNauruNepalNetherlandsNew CaledoniaNew ZealandNicaraguaNigerNigeriaNorth AmericaNorthern Mariana IslandsNorwayOECD membersOmanOther small statesPacific island small statesPakistanPalauPanamaPapua New GuineaParaguayPeruPhilippinesPolandPortugalPost-demographic dividendPre-demographic dividendPuerto RicoQatarRomaniaRussian FederationRwandaSamoaSao Tome and PrincipeSaudi ArabiaSenegalSerbiaSeychellesSierra LeoneSingaporeSlovak RepublicSloveniaSmall statesSolomon IslandsSomaliaSouth AfricaSouth AsiaSouth Asia (IDA & IBRD)SpainSri LankaSt. Kitts and NevisSt. LuciaSt. Vincent and the GrenadinesSub-Saharan Africa Sub-Saharan Africa (excluding high income)Sub-Saharan Africa (IDA & IBRD countries)SudanSurinameSwazilandSwedenSwitzerlandSyrian Arab RepublicTajikistanTanzaniaThailandTimor-LesteTogoTongaTrinidad and TobagoTunisiaTurkeyTurkmenistanTurks and Caicos IslandsTuvaluUgandaUkraineUnited Arab EmiratesUnited KingdomUnited StatesUpper middle incomeUruguayUzbekistanVanuatuVenezuela, RBVietnamVirgin Islands (U.S.)WorldYemen, Rep.ZambiaZimbabwe Linea del tempo:
Questa scala temporale mostra un grafico dal 1971 anno al 2009 anno. Sao Tome and Principe. I dati fino ad 1970 anno non disponibili. Il numero di osservazioni attuali secondo i date: 39.
La fonte (nome):
Indicatori dello sviluppo mondiale
La fonte (organizzazione):
World Bank staff estimates from original source: European Commission, Joint Research Centre (JRC)/Netherlands Environmental Assessment Agency (PBL). Emission Database for Global Atmospheric Research (EDGAR): http://edgar.jrc.ec.europa.eu/.
Categorie:
Energy & Mining, Environment
sono stati aggiornati
23 apr 2017 anni
Indicatori delle variazioni dei valori per anni
Minima:
5.553
1 gen 1971 anni
Massimo:
14.762
1 gen 2001 anni
Alla data di osservazione
Valore
Variazione assoluta
La variazione rispetto al valore precedente
1 gen 1971 anni
5.553
+5.553
0.0%
1 gen 1972 anni
5.721
+0.168
3.03%
1 gen 1973 anni
6.449
+0.728
12.72%
1 gen 1974 anni
6.391
-0.058
-0.9%
1 gen 1975 anni
7.239
+0.848
13.26%
1 gen 1976 anni
7.66
+0.421
5.82%
1 gen 1977 anni
6.919
-0.741
-9.67%
1 gen 1978 anni
7.543
+0.624
9.02%
1 gen 1979 anni
8.423
+0.879
11.65%
1 gen 1980 anni
9.217
+0.794
9.43%
1 gen 1981 anni
9.482
+0.266
2.88%
1 gen 1982 anni
8.152
-1.33
-14.02%
1 gen 1983 anni
9.568
+1.415
17.36%
1 gen 1984 anni
9.987
+0.42
4.38%
1 gen 1985 anni
9.986
-0.001
-0.01%
1 gen 1986 anni
9.961
-0.025
-0.25%
1 gen 1987 anni
10.402
+0.441
4.42%
1 gen 1988 anni
10.326
-0.076
-0.73%
1 gen 1989 anni
7.713
-2.613
-25.3%
1 gen 1990 anni
7.57
-0.143
-1.85%
1 gen 1991 anni
9.653
+2.083
27.52%
1 gen 1992 anni
9.912
+0.259
2.68%
1 gen 1993 anni
9.383
-0.529
-5.34%
1 gen 1994 anni
9.427
+0.044
0.47%
1 gen 1995 anni
12.079
+2.653
28.14%
1 gen 1996 anni
12.459
+0.38
3.15%
1 gen 1997 anni
12.36
-0.1
-0.8%
1 gen 1998 anni
12.541
+0.181
1.47%
1 gen 1999 anni
12.406
-0.135
-1.08%
1 gen 2000 anni
12.59
+0.184
1.48%
1 gen 2001 anni
14.762
+2.172
17.25%
1 gen 2002 anni
14.206
-0.556
-3.77%
1 gen 2003 anni
14.05
-0.156
-1.1%
1 gen 2004 anni
14.226
+0.176
1.25%
1 gen 2005 anni
14.655
+0.429
3.02%
1 gen 2006 anni
14.588
-0.067
-0.46%
1 gen 2007 anni
13.719
-0.868
-5.95%
1 gen 2008 anni
14.112
+0.393
2.87%
1 gen 2009 anni
14.3
+0.188
1.33%
Classificazione dei paesi secondo i statistiche attuali per anni


Commenti: