29
/it/
it
AIzaSyAYiBZKx7MnpbEhh9jyipgxe19OcubqV5w
April 1, 2024
219964
Papua New Guinea
PNG
true
2
1
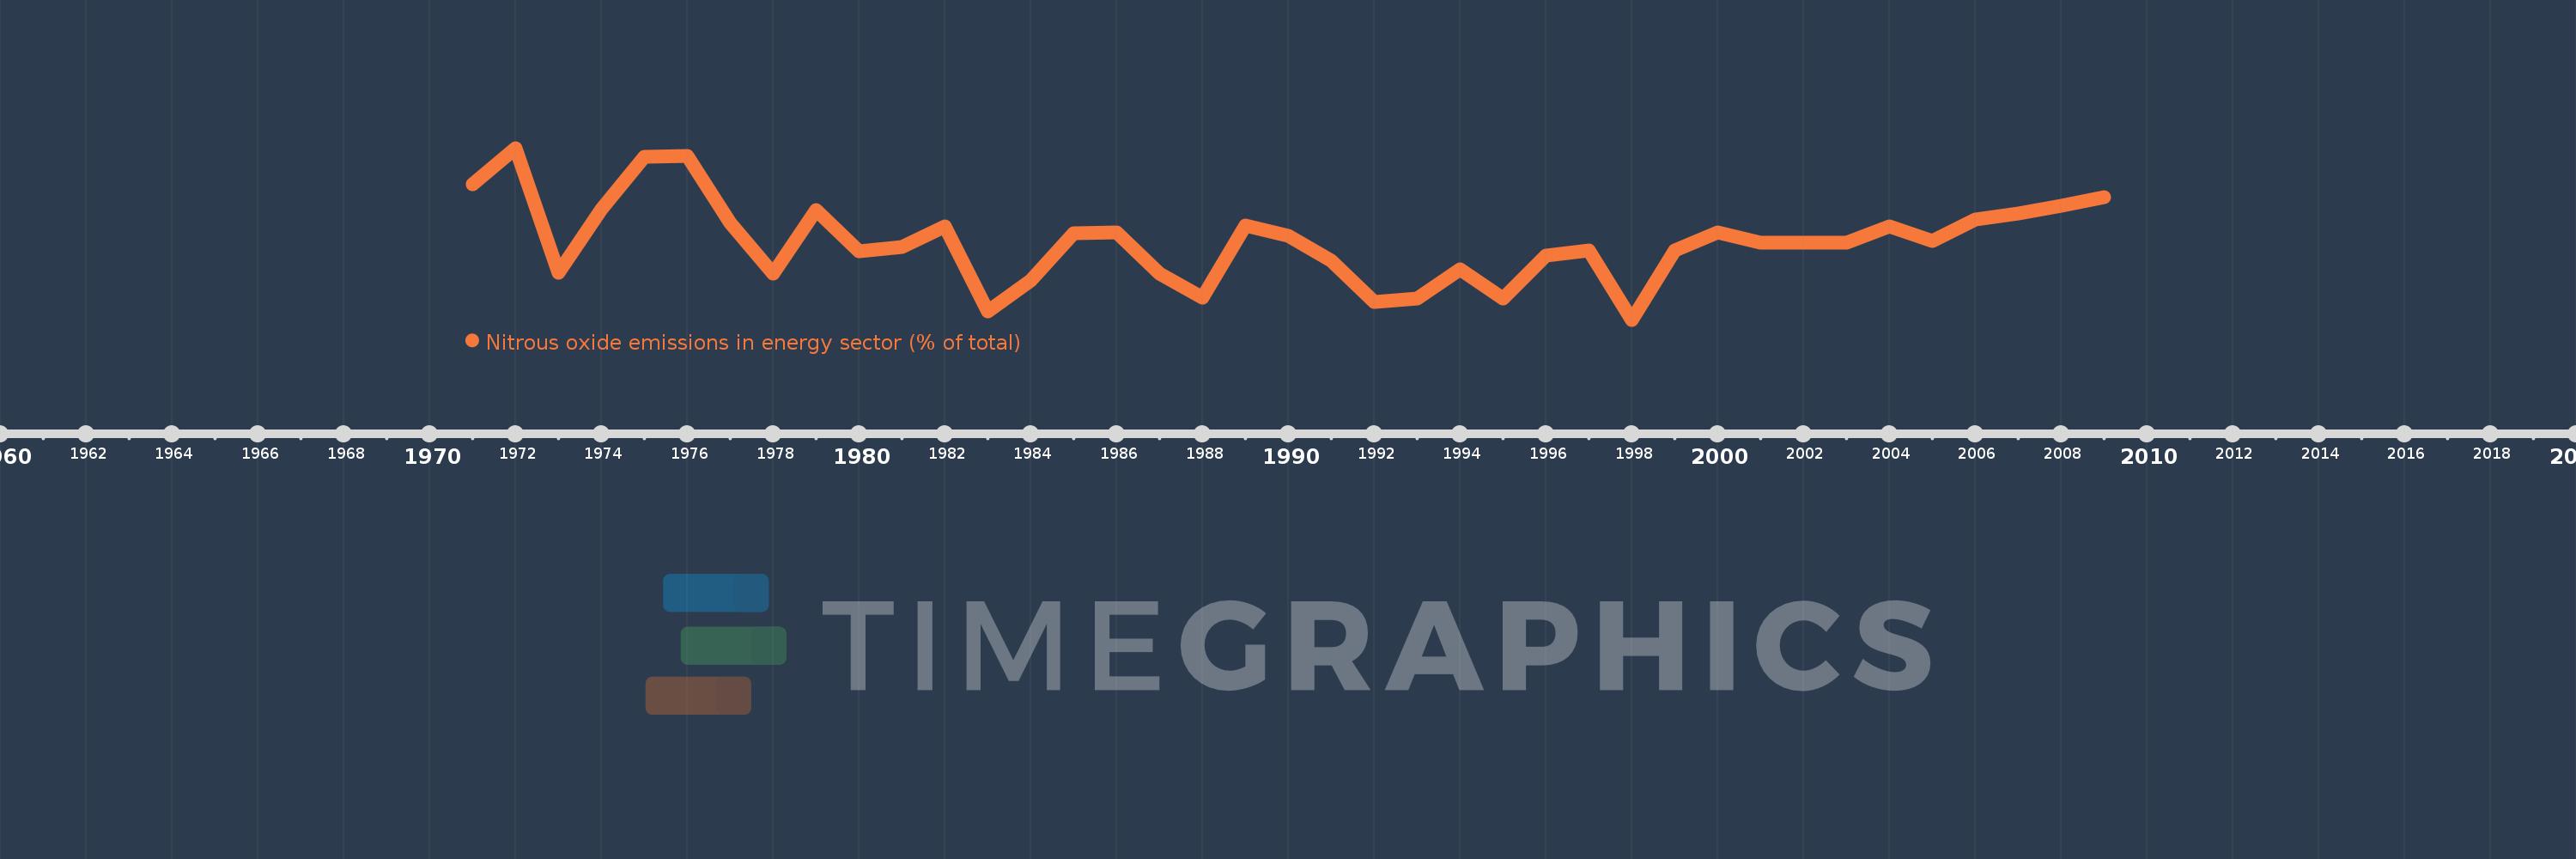
Nitrous oxide emissions in energy sector (% of total)
2009,2008,2007,2006,2005,2004,2003,2002,2001,2000,1999,1998,1997,1996,1995,1994,1993,1992,1991,1990,1989,1988,1987,1986,1985,1984,1983,1982,1981,1980,1979,1978,1977,1976,1975,1974,1973,1972,1971
Queste statistiche in altri paesi:
AfghanistanAlbaniaAlgeriaAmerican SamoaAndorraAngolaAntigua and BarbudaArab WorldArgentinaArmeniaArubaAustraliaAustriaAzerbaijanBahamas, TheBahrainBangladeshBarbadosBelarusBelgiumBelizeBeninBermudaBhutanBoliviaBosnia and HerzegovinaBotswanaBrazilBritish Virgin IslandsBrunei DarussalamBulgariaBurkina FasoBurundiCabo VerdeCambodiaCameroonCanadaCaribbean small statesCayman IslandsCentral African RepublicCentral Europe and the BalticsChadChileChinaColombiaComorosCongo, Dem. Rep.Congo, Rep.Costa RicaCote d'IvoireCroatiaCubaCyprusCzech RepublicDenmarkDjiboutiDominicaDominican RepublicEarly-demographic dividendEast Asia & PacificEast Asia & Pacific (excluding high income)East Asia & Pacific (IDA & IBRD countries)EcuadorEgypt, Arab Rep.El SalvadorEquatorial GuineaEritreaEstoniaEthiopiaEuro areaEurope & Central AsiaEurope & Central Asia (excluding high income)Europe & Central Asia (IDA & IBRD countries)European UnionFaroe IslandsFijiFinlandFragile and conflict affected situationsFranceFrench PolynesiaGabonGambia, TheGeorgiaGermanyGhanaGibraltarGreeceGreenlandGrenadaGuamGuatemalaGuineaGuinea-BissauGuyanaHaitiHeavily indebted poor countries (HIPC)High incomeHondurasHong Kong SAR, ChinaHungaryIBRD onlyIcelandIDA & IBRD totalIDA blendIDA onlyIDA totalIndiaIndonesiaIran, Islamic Rep.IraqIrelandIsraelItalyJamaicaJapanJordanKazakhstanKenyaKiribatiKorea, Dem. People’s Rep.Korea, Rep.KuwaitKyrgyz RepublicLao PDRLate-demographic dividendLatin America & Caribbean Latin America & Caribbean (excluding high income)Latin America & the Caribbean (IDA & IBRD countries)LatviaLeast developed countries: UN classificationLebanonLesothoLiberiaLibyaLithuaniaLow & middle incomeLow incomeLower middle incomeLuxembourgMacao SAR, ChinaMacedonia, FYRMadagascarMalawiMalaysiaMaldivesMaliMaltaMarshall IslandsMauritaniaMauritiusMexicoMicronesia, Fed. Sts.Middle East & North AfricaMiddle East & North Africa (excluding high income)Middle East & North Africa (IDA & IBRD countries)Middle incomeMoldovaMongoliaMoroccoMozambiqueMyanmarNamibiaNauruNepalNetherlandsNew CaledoniaNew ZealandNicaraguaNigerNigeriaNorth AmericaNorthern Mariana IslandsNorwayOECD membersOmanOther small statesPacific island small statesPakistanPalauPanamaPapua New GuineaParaguayPeruPhilippinesPolandPortugalPost-demographic dividendPre-demographic dividendPuerto RicoQatarRomaniaRussian FederationRwandaSamoaSao Tome and PrincipeSaudi ArabiaSenegalSerbiaSeychellesSierra LeoneSingaporeSlovak RepublicSloveniaSmall statesSolomon IslandsSomaliaSouth AfricaSouth AsiaSouth Asia (IDA & IBRD)SpainSri LankaSt. Kitts and NevisSt. LuciaSt. Vincent and the GrenadinesSub-Saharan Africa Sub-Saharan Africa (excluding high income)Sub-Saharan Africa (IDA & IBRD countries)SudanSurinameSwazilandSwedenSwitzerlandSyrian Arab RepublicTajikistanTanzaniaThailandTimor-LesteTogoTongaTrinidad and TobagoTunisiaTurkeyTurkmenistanTurks and Caicos IslandsTuvaluUgandaUkraineUnited Arab EmiratesUnited KingdomUnited StatesUpper middle incomeUruguayUzbekistanVanuatuVenezuela, RBVietnamVirgin Islands (U.S.)WorldYemen, Rep.ZambiaZimbabwe Linea del tempo:
Questa scala temporale mostra un grafico dal 1971 anno al 2009 anno. Papua New Guinea. I dati fino ad 1970 anno non disponibili. Il numero di osservazioni attuali secondo i date: 39.
La fonte (nome):
Indicatori dello sviluppo mondiale
La fonte (organizzazione):
World Bank staff estimates from original source: European Commission, Joint Research Centre (JRC)/Netherlands Environmental Assessment Agency (PBL). Emission Database for Global Atmospheric Research (EDGAR): http://edgar.jrc.ec.europa.eu/.
Categorie:
Energy & Mining, Environment
sono stati aggiornati
23 apr 2017 anni
Indicatori delle variazioni dei valori per anni
Minima:
0.85
1 gen 1998 anni
Massimo:
12.792
1 gen 1972 anni
Alla data di osservazione
Valore
Variazione assoluta
La variazione rispetto al valore precedente
1 gen 1971 anni
10.282
+10.282
0.0%
1 gen 1972 anni
12.792
+2.509
24.4%
1 gen 1973 anni
4.104
-8.688
-67.92%
1 gen 1974 anni
8.556
+4.452
108.48%
1 gen 1975 anni
12.179
+3.623
42.35%
1 gen 1976 anni
12.252
+0.073
0.6%
1 gen 1977 anni
7.596
-4.657
-38.01%
1 gen 1978 anni
4.085
-3.511
-46.22%
1 gen 1979 anni
8.497
+4.412
108.0%
1 gen 1980 anni
5.607
-2.889
-34.0%
1 gen 1981 anni
5.904
+0.297
5.29%
1 gen 1982 anni
7.363
+1.459
24.71%
1 gen 1983 anni
1.42
-5.944
-80.72%
1 gen 1984 anni
3.594
+2.174
153.18%
1 gen 1985 anni
6.868
+3.274
91.1%
1 gen 1986 anni
6.952
+0.084
1.22%
1 gen 1987 anni
4.055
-2.897
-41.67%
1 gen 1988 anni
2.375
-1.68
-41.43%
1 gen 1989 anni
7.376
+5.001
210.57%
1 gen 1990 anni
6.679
-0.697
-9.45%
1 gen 1991 anni
4.929
-1.75
-26.2%
1 gen 1992 anni
2.089
-2.841
-57.63%
1 gen 1993 anni
2.322
+0.233
11.16%
1 gen 1994 anni
4.335
+2.013
86.7%
1 gen 1995 anni
2.324
-2.011
-46.39%
1 gen 1996 anni
5.302
+2.978
128.17%
1 gen 1997 anni
5.69
+0.388
7.32%
1 gen 1998 anni
0.85
-4.84
-85.06%
1 gen 1999 anni
5.668
+4.818
566.73%
1 gen 2000 anni
6.916
+1.248
22.02%
1 gen 2001 anni
6.198
-0.717
-10.37%
1 gen 2002 anni
6.215
+0.016
0.27%
1 gen 2003 anni
6.184
-0.031
-0.5%
1 gen 2004 anni
7.345
+1.161
18.77%
1 gen 2005 anni
6.344
-1.001
-13.63%
1 gen 2006 anni
7.812
+1.468
23.14%
1 gen 2007 anni
8.258
+0.446
5.71%
1 gen 2008 anni
8.776
+0.518
6.28%
1 gen 2009 anni
9.396
+0.62
7.07%
Classificazione dei paesi secondo i statistiche attuali per anni


Commenti: