29
/it/
it
AIzaSyAYiBZKx7MnpbEhh9jyipgxe19OcubqV5w
April 1, 2024
246028
South Africa
ZAF
true
2
1
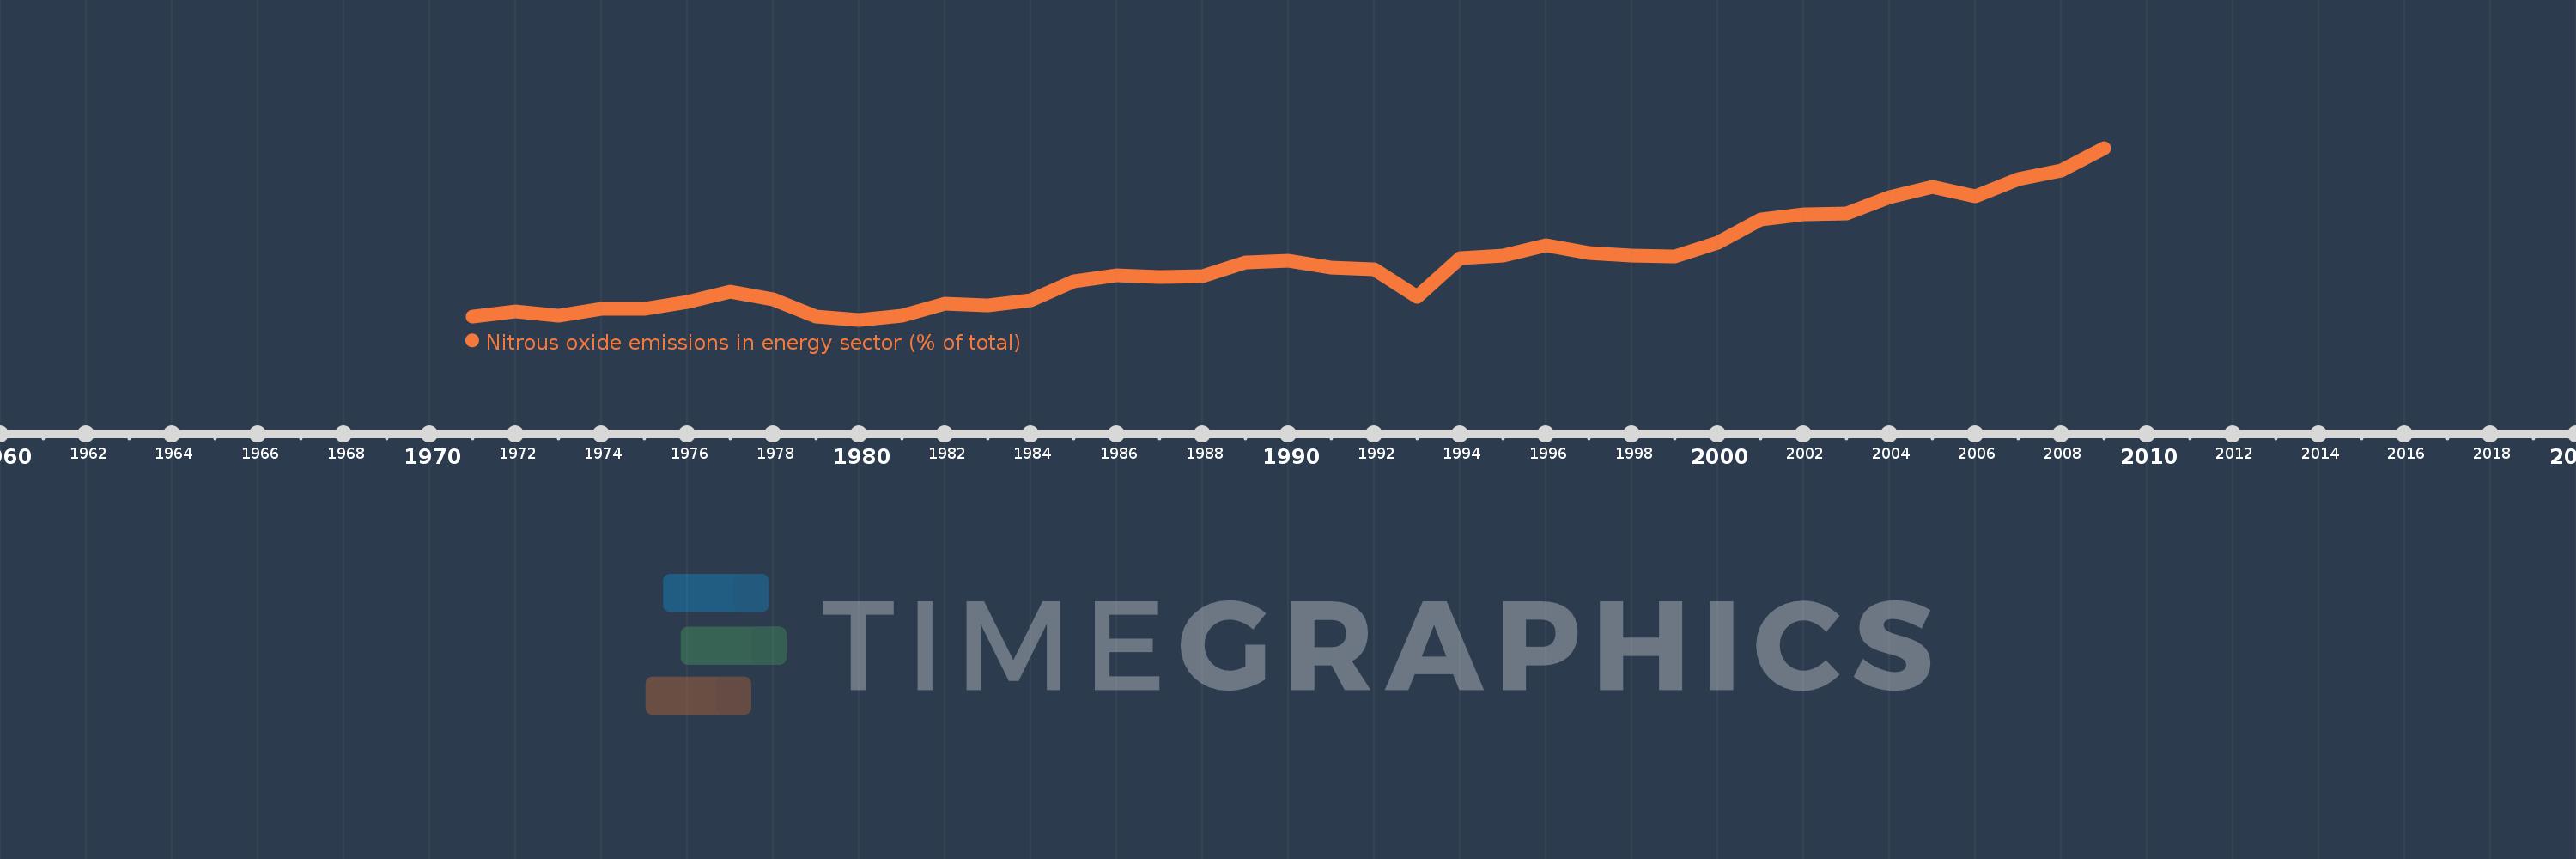
Nitrous oxide emissions in energy sector (% of total)
2009,2008,2007,2006,2005,2004,2003,2002,2001,2000,1999,1998,1997,1996,1995,1994,1993,1992,1991,1990,1989,1988,1987,1986,1985,1984,1983,1982,1981,1980,1979,1978,1977,1976,1975,1974,1973,1972,1971
Queste statistiche in altri paesi:
AfghanistanAlbaniaAlgeriaAmerican SamoaAndorraAngolaAntigua and BarbudaArab WorldArgentinaArmeniaArubaAustraliaAustriaAzerbaijanBahamas, TheBahrainBangladeshBarbadosBelarusBelgiumBelizeBeninBermudaBhutanBoliviaBosnia and HerzegovinaBotswanaBrazilBritish Virgin IslandsBrunei DarussalamBulgariaBurkina FasoBurundiCabo VerdeCambodiaCameroonCanadaCaribbean small statesCayman IslandsCentral African RepublicCentral Europe and the BalticsChadChileChinaColombiaComorosCongo, Dem. Rep.Congo, Rep.Costa RicaCote d'IvoireCroatiaCubaCyprusCzech RepublicDenmarkDjiboutiDominicaDominican RepublicEarly-demographic dividendEast Asia & PacificEast Asia & Pacific (excluding high income)East Asia & Pacific (IDA & IBRD countries)EcuadorEgypt, Arab Rep.El SalvadorEquatorial GuineaEritreaEstoniaEthiopiaEuro areaEurope & Central AsiaEurope & Central Asia (excluding high income)Europe & Central Asia (IDA & IBRD countries)European UnionFaroe IslandsFijiFinlandFragile and conflict affected situationsFranceFrench PolynesiaGabonGambia, TheGeorgiaGermanyGhanaGibraltarGreeceGreenlandGrenadaGuamGuatemalaGuineaGuinea-BissauGuyanaHaitiHeavily indebted poor countries (HIPC)High incomeHondurasHong Kong SAR, ChinaHungaryIBRD onlyIcelandIDA & IBRD totalIDA blendIDA onlyIDA totalIndiaIndonesiaIran, Islamic Rep.IraqIrelandIsraelItalyJamaicaJapanJordanKazakhstanKenyaKiribatiKorea, Dem. People’s Rep.Korea, Rep.KuwaitKyrgyz RepublicLao PDRLate-demographic dividendLatin America & Caribbean Latin America & Caribbean (excluding high income)Latin America & the Caribbean (IDA & IBRD countries)LatviaLeast developed countries: UN classificationLebanonLesothoLiberiaLibyaLithuaniaLow & middle incomeLow incomeLower middle incomeLuxembourgMacao SAR, ChinaMacedonia, FYRMadagascarMalawiMalaysiaMaldivesMaliMaltaMarshall IslandsMauritaniaMauritiusMexicoMicronesia, Fed. Sts.Middle East & North AfricaMiddle East & North Africa (excluding high income)Middle East & North Africa (IDA & IBRD countries)Middle incomeMoldovaMongoliaMoroccoMozambiqueMyanmarNamibiaNauruNepalNetherlandsNew CaledoniaNew ZealandNicaraguaNigerNigeriaNorth AmericaNorthern Mariana IslandsNorwayOECD membersOmanOther small statesPacific island small statesPakistanPalauPanamaPapua New GuineaParaguayPeruPhilippinesPolandPortugalPost-demographic dividendPre-demographic dividendPuerto RicoQatarRomaniaRussian FederationRwandaSamoaSao Tome and PrincipeSaudi ArabiaSenegalSerbiaSeychellesSierra LeoneSingaporeSlovak RepublicSloveniaSmall statesSolomon IslandsSomaliaSouth AfricaSouth AsiaSouth Asia (IDA & IBRD)SpainSri LankaSt. Kitts and NevisSt. LuciaSt. Vincent and the GrenadinesSub-Saharan Africa Sub-Saharan Africa (excluding high income)Sub-Saharan Africa (IDA & IBRD countries)SudanSurinameSwazilandSwedenSwitzerlandSyrian Arab RepublicTajikistanTanzaniaThailandTimor-LesteTogoTongaTrinidad and TobagoTunisiaTurkeyTurkmenistanTurks and Caicos IslandsTuvaluUgandaUkraineUnited Arab EmiratesUnited KingdomUnited StatesUpper middle incomeUruguayUzbekistanVanuatuVenezuela, RBVietnamVirgin Islands (U.S.)WorldYemen, Rep.ZambiaZimbabwe Linea del tempo:
Questa scala temporale mostra un grafico dal 1971 anno al 2009 anno. South Africa. I dati fino ad 1970 anno non disponibili. Il numero di osservazioni attuali secondo i date: 39.
La fonte (nome):
Indicatori dello sviluppo mondiale
La fonte (organizzazione):
World Bank staff estimates from original source: European Commission, Joint Research Centre (JRC)/Netherlands Environmental Assessment Agency (PBL). Emission Database for Global Atmospheric Research (EDGAR): http://edgar.jrc.ec.europa.eu/.
Categorie:
Energy & Mining, Environment
sono stati aggiornati
23 apr 2017 anni
Indicatori delle variazioni dei valori per anni
Minima:
6.537
1 gen 1980 anni
Massimo:
11.918
1 gen 2009 anni
Alla data di osservazione
Valore
Variazione assoluta
La variazione rispetto al valore precedente
1 gen 1971 anni
6.647
+6.647
0.0%
1 gen 1972 anni
6.798
+0.152
2.28%
1 gen 1973 anni
6.653
-0.145
-2.14%
1 gen 1974 anni
6.879
+0.226
3.4%
1 gen 1975 anni
6.876
-0.003
-0.04%
1 gen 1976 anni
7.086
+0.21
3.06%
1 gen 1977 anni
7.414
+0.328
4.63%
1 gen 1978 anni
7.175
-0.24
-3.23%
1 gen 1979 anni
6.639
-0.536
-7.47%
1 gen 1980 anni
6.537
-0.103
-1.54%
1 gen 1981 anni
6.661
+0.124
1.9%
1 gen 1982 anni
7.038
+0.377
5.66%
1 gen 1983 anni
6.973
-0.065
-0.92%
1 gen 1984 anni
7.142
+0.168
2.41%
1 gen 1985 anni
7.738
+0.597
8.35%
1 gen 1986 anni
7.938
+0.199
2.58%
1 gen 1987 anni
7.883
-0.055
-0.69%
1 gen 1988 anni
7.889
+0.006
0.08%
1 gen 1989 anni
8.342
+0.452
5.73%
1 gen 1990 anni
8.375
+0.033
0.39%
1 gen 1991 anni
8.165
-0.21
-2.51%
1 gen 1992 anni
8.12
-0.044
-0.54%
1 gen 1993 anni
7.248
-0.873
-10.75%
1 gen 1994 anni
8.478
+1.231
16.98%
1 gen 1995 anni
8.557
+0.079
0.93%
1 gen 1996 anni
8.864
+0.306
3.58%
1 gen 1997 anni
8.622
-0.242
-2.73%
1 gen 1998 anni
8.547
-0.074
-0.86%
1 gen 1999 anni
8.533
-0.014
-0.17%
1 gen 2000 anni
8.952
+0.419
4.91%
1 gen 2001 anni
9.685
+0.733
8.19%
1 gen 2002 anni
9.85
+0.165
1.7%
1 gen 2003 anni
9.868
+0.019
0.19%
1 gen 2004 anni
10.383
+0.515
5.22%
1 gen 2005 anni
10.686
+0.302
2.91%
1 gen 2006 anni
10.405
-0.281
-2.63%
1 gen 2007 anni
10.941
+0.536
5.15%
1 gen 2008 anni
11.219
+0.278
2.54%
1 gen 2009 anni
11.918
+0.699
6.23%
Classificazione dei paesi secondo i statistiche attuali per anni


Commenti: