30
/it/
AIzaSyAYiBZKx7MnpbEhh9jyipgxe19OcubqV5w
April 1, 2024
40410
IDA total
IDA
false
2
1
Trained teachers in preprimary education (% of total teachers)
2015,2014,2013,2012,2011,2010,2009,2008,2007,2006,2005,2004
Download
Biblioteca di statistiche globali →IDA total →

Trained teachers in preprimary education (% of total teachers)

Queste statistiche in altri paesi:

AndorraAngolaAntigua and BarbudaArab WorldArmeniaArubaAzerbaijanBahamas, TheBahrainBarbadosBelarusBelizeBeninBermudaBhutanBoliviaBotswanaBritish Virgin IslandsBrunei DarussalamBurkina FasoBurundiCabo VerdeCambodiaCameroonCaribbean small statesCayman IslandsChadColombiaCongo, Dem. Rep.Congo, Rep.Costa RicaCote d'IvoireCroatiaCubaDjiboutiDominicaDominican RepublicEcuadorEgypt, Arab Rep.El SalvadorEritreaEthiopiaFragile and conflict affected situationsGambia, TheGeorgiaGhanaGibraltarGrenadaGuineaGuinea-BissauGuyanaHeavily indebted poor countries (HIPC)HondurasIDA blendIDA onlyIDA totalIran, Islamic Rep.IraqKazakhstanKenyaKuwaitKyrgyz RepublicLao PDRLatin America & Caribbean Latin America & Caribbean (excluding high income)Latin America & the Caribbean (IDA & IBRD countries)Least developed countries: UN classificationLebanonLiberiaLow incomeMacao SAR, ChinaMadagascarMalaysiaMaldivesMaliMarshall IslandsMauritaniaMauritiusMexicoMiddle East & North AfricaMiddle East & North Africa (excluding high income)Middle East & North Africa (IDA & IBRD countries)MoldovaMongoliaMoroccoMyanmarNamibiaNauruNepalNicaraguaNigerOmanOther small statesPacific island small statesPanamaParaguayPre-demographic dividendQatarRwandaSamoaSao Tome and PrincipeSaudi ArabiaSenegalSerbiaSeychellesSierra LeoneSmall statesSolomon IslandsSouth AfricaSouth SudanSt. Kitts and NevisSt. LuciaSt. Vincent and the GrenadinesSub-Saharan Africa Sub-Saharan Africa (excluding high income)Sub-Saharan Africa (IDA & IBRD countries)SurinameSwazilandSyrian Arab RepublicTajikistanTanzaniaTogoTongaTrinidad and TobagoTunisiaTuvaluUnited Arab EmiratesUzbekistanVanuatuVietnamWest Bank and GazaZimbabwe

Linea del tempo:

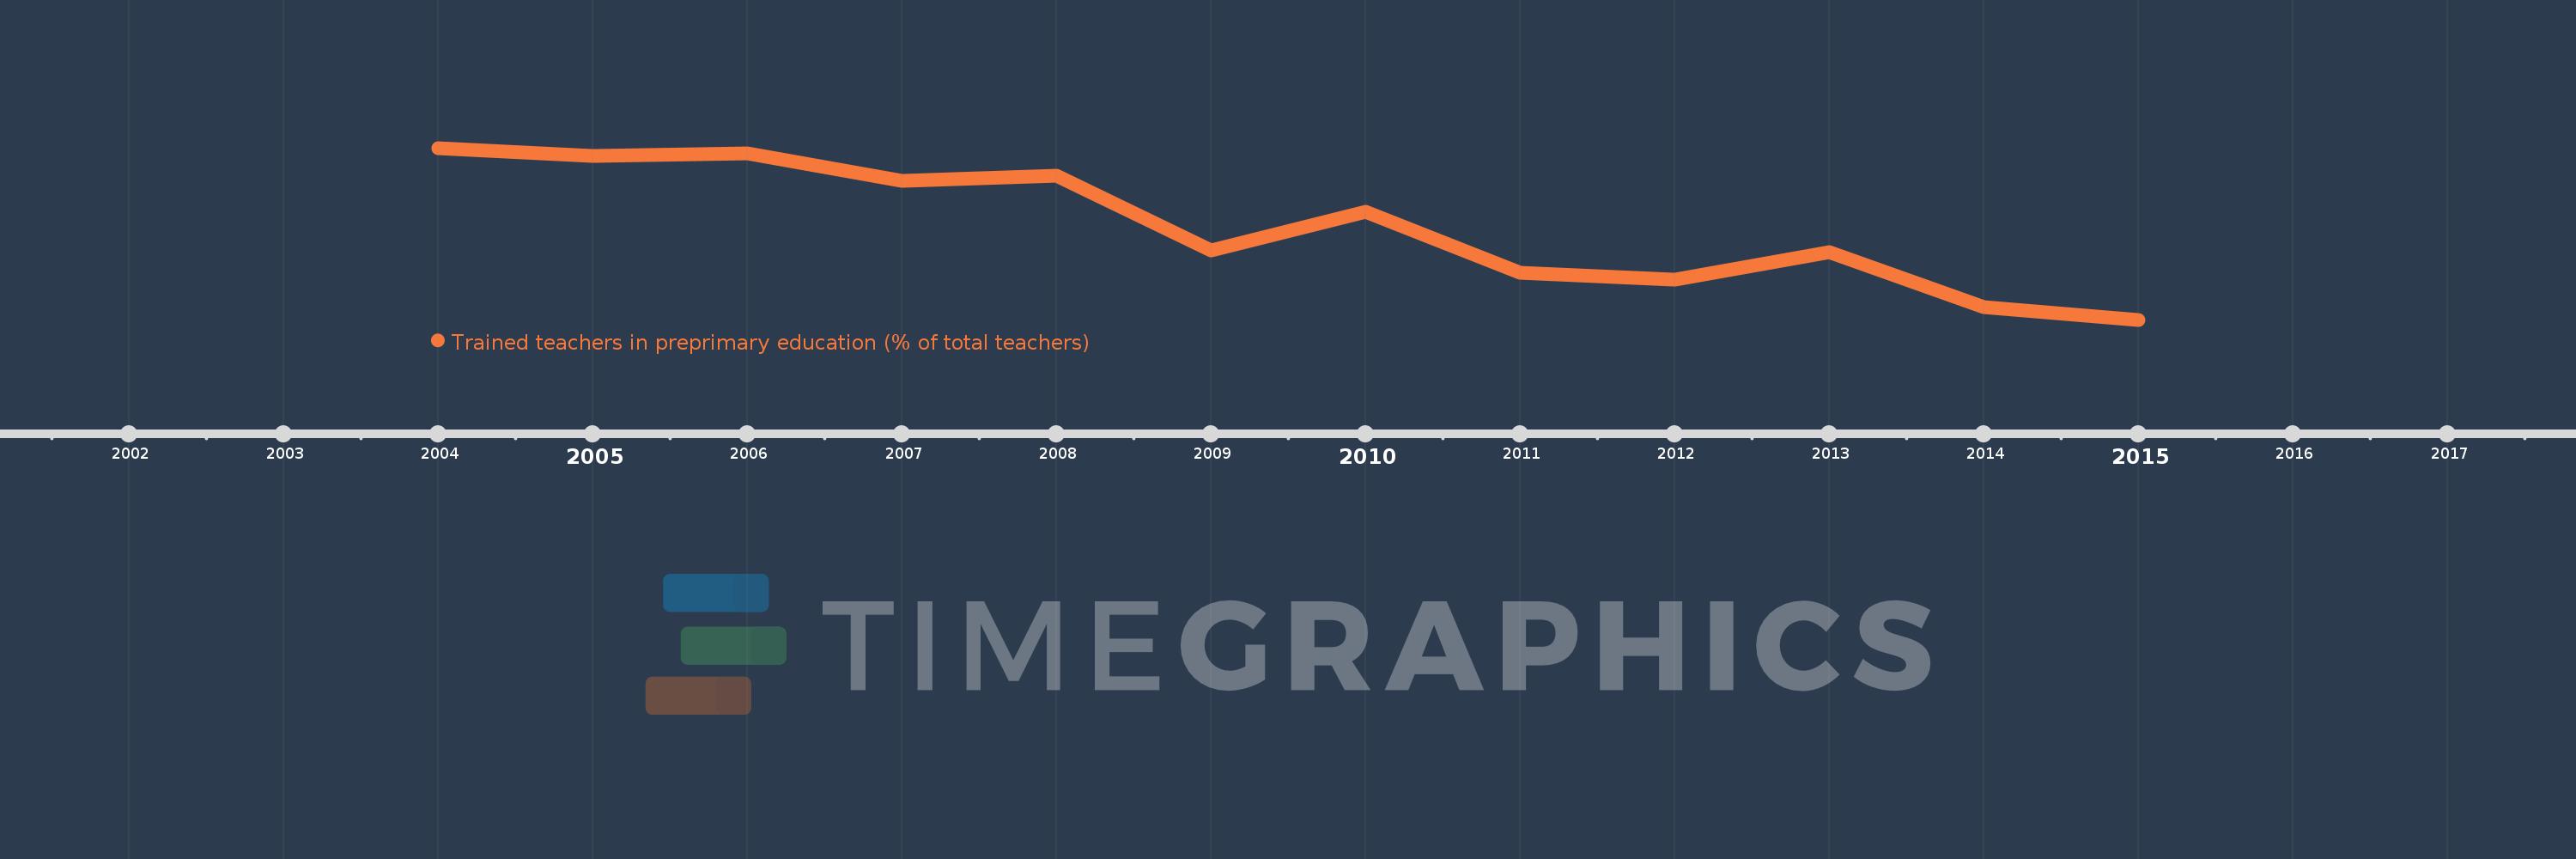
Questa scala temporale mostra un grafico dal 2004 anno al 2015 anno. IDA total. I dati fino ad 2003 anno non disponibili. Il numero di osservazioni attuali secondo i date: 12.

La fonte (nome):

Indicatori dello sviluppo mondiale

La fonte (organizzazione):

United Nations Educational, Scientific, and Cultural Organization (UNESCO) Institute for Statistics.

Categorie:

Education

sono stati aggiornati

23 apr 2017 anni

Indicatori delle variazioni dei valori per anni

In media:
66.28
Minima:
60.829
1 gen 2015 anni
Massimo:
70.776
1 gen 2004 anni
Alla data di osservazione
Valore
Variazione assoluta
La variazione rispetto al valore precedente
1 gen 2004 anni
70.776
+70.776
0.0%
1 gen 2005 anni
70.303
-0.473
-0.67%
1 gen 2006 anni
70.461
+0.158
0.23%
1 gen 2007 anni
68.886
-1.575
-2.24%
1 gen 2008 anni
69.162
+0.276
0.4%
1 gen 2009 anni
64.843
-4.319
-6.24%
1 gen 2010 anni
67.065
+2.222
3.43%
1 gen 2011 anni
63.562
-3.503
-5.22%
1 gen 2012 anni
63.176
-0.385
-0.61%
1 gen 2013 anni
64.734
+1.558
2.47%
1 gen 2014 anni
61.568
-3.166
-4.89%
1 gen 2015 anni
60.829
-0.739
-1.2%

Classificazione dei paesi secondo i statistiche attuali per anni