30
/it/
AIzaSyAYiBZKx7MnpbEhh9jyipgxe19OcubqV5w
April 1, 2024
113094
Costa Rica
CRI
true
2
1
Trained teachers in preprimary education (% of total teachers)
2015,2014,2012,2011,2010,2009,2008,2007,2006,2005,2003,2002,2000
Download
Biblioteca di statistiche globali →Costa Rica →

Trained teachers in preprimary education (% of total teachers)

Queste statistiche in altri paesi:

AndorraAngolaAntigua and BarbudaArab WorldArmeniaArubaAzerbaijanBahamas, TheBahrainBarbadosBelarusBelizeBeninBermudaBhutanBoliviaBotswanaBritish Virgin IslandsBrunei DarussalamBurkina FasoBurundiCabo VerdeCambodiaCameroonCaribbean small statesCayman IslandsChadColombiaCongo, Dem. Rep.Congo, Rep.Costa RicaCote d'IvoireCroatiaCubaDjiboutiDominicaDominican RepublicEcuadorEgypt, Arab Rep.El SalvadorEritreaEthiopiaFragile and conflict affected situationsGambia, TheGeorgiaGhanaGibraltarGrenadaGuineaGuinea-BissauGuyanaHeavily indebted poor countries (HIPC)HondurasIDA blendIDA onlyIDA totalIran, Islamic Rep.IraqKazakhstanKenyaKuwaitKyrgyz RepublicLao PDRLatin America & Caribbean Latin America & Caribbean (excluding high income)Latin America & the Caribbean (IDA & IBRD countries)Least developed countries: UN classificationLebanonLiberiaLow incomeMacao SAR, ChinaMadagascarMalaysiaMaldivesMaliMarshall IslandsMauritaniaMauritiusMexicoMiddle East & North AfricaMiddle East & North Africa (excluding high income)Middle East & North Africa (IDA & IBRD countries)MoldovaMongoliaMoroccoMyanmarNamibiaNauruNepalNicaraguaNigerOmanOther small statesPacific island small statesPanamaParaguayPre-demographic dividendQatarRwandaSamoaSao Tome and PrincipeSaudi ArabiaSenegalSerbiaSeychellesSierra LeoneSmall statesSolomon IslandsSouth AfricaSouth SudanSt. Kitts and NevisSt. LuciaSt. Vincent and the GrenadinesSub-Saharan Africa Sub-Saharan Africa (excluding high income)Sub-Saharan Africa (IDA & IBRD countries)SurinameSwazilandSyrian Arab RepublicTajikistanTanzaniaTogoTongaTrinidad and TobagoTunisiaTuvaluUnited Arab EmiratesUzbekistanVanuatuVietnamWest Bank and GazaZimbabwe

Linea del tempo:

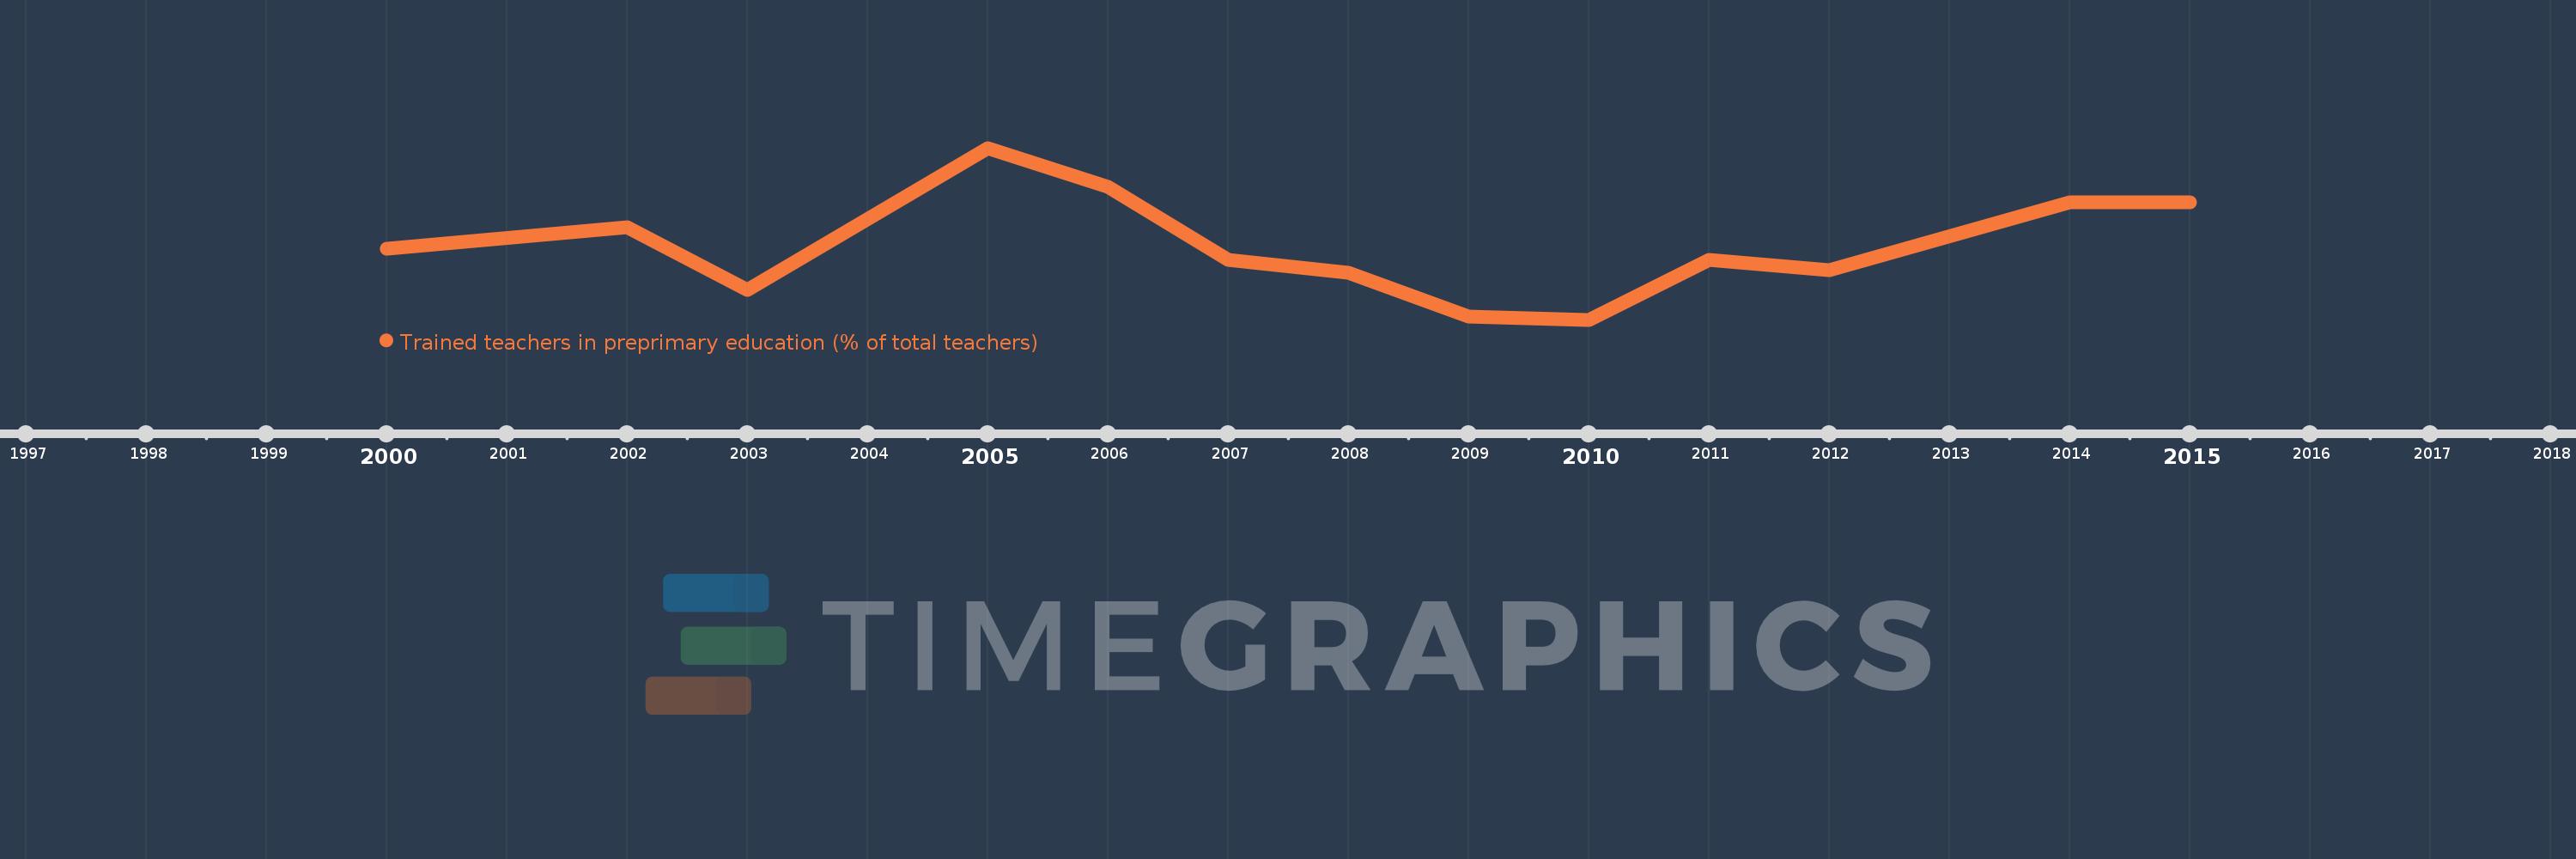
Questa scala temporale mostra un grafico dal 2000 anno al 2015 anno. Costa Rica. I dati fino ad 1999 anno non disponibili. Il numero di osservazioni attuali secondo i date: 13.

La fonte (nome):

Indicatori dello sviluppo mondiale

La fonte (organizzazione):

United Nations Educational, Scientific, and Cultural Organization (UNESCO) Institute for Statistics.

Categorie:

Education

sono stati aggiornati

23 apr 2017 anni

Indicatori delle variazioni dei valori per anni

In media:
82.99
Minima:
76.637
1 gen 2010 anni
Massimo:
91.495
1 gen 2005 anni
Alla data di osservazione
Valore
Variazione assoluta
La variazione rispetto al valore precedente
1 gen 2000 anni
82.806
+82.806
0.0%
1 gen 2002 anni
84.659
+1.854
2.24%
1 gen 2003 anni
79.235
-5.425
-6.41%
1 gen 2005 anni
91.495
+12.26
15.47%
1 gen 2006 anni
88.132
-3.362
-3.68%
1 gen 2007 anni
81.84
-6.293
-7.14%
1 gen 2008 anni
80.706
-1.134
-1.39%
1 gen 2009 anni
76.944
-3.762
-4.66%
1 gen 2010 anni
76.637
-0.307
-0.4%
1 gen 2011 anni
81.848
+5.211
6.8%
1 gen 2012 anni
80.918
-0.931
-1.14%
1 gen 2014 anni
86.829
+5.911
7.31%
1 gen 2015 anni
86.82
-0.01
-0.01%

Classificazione dei paesi secondo i statistiche attuali per anni