30
/it/
AIzaSyAYiBZKx7MnpbEhh9jyipgxe19OcubqV5w
April 1, 2024
189729
Maldives
MDV
true
2
1
Trained teachers in preprimary education (% of total teachers)
2015,2014,2013,2012,2011,2010,2007,2006,2004,2003,2002,2001,2000,1999
Download
Biblioteca di statistiche globali →Maldives →

Trained teachers in preprimary education (% of total teachers)

Queste statistiche in altri paesi:

AndorraAngolaAntigua and BarbudaArab WorldArmeniaArubaAzerbaijanBahamas, TheBahrainBarbadosBelarusBelizeBeninBermudaBhutanBoliviaBotswanaBritish Virgin IslandsBrunei DarussalamBurkina FasoBurundiCabo VerdeCambodiaCameroonCaribbean small statesCayman IslandsChadColombiaCongo, Dem. Rep.Congo, Rep.Costa RicaCote d'IvoireCroatiaCubaDjiboutiDominicaDominican RepublicEcuadorEgypt, Arab Rep.El SalvadorEritreaEthiopiaFragile and conflict affected situationsGambia, TheGeorgiaGhanaGibraltarGrenadaGuineaGuinea-BissauGuyanaHeavily indebted poor countries (HIPC)HondurasIDA blendIDA onlyIDA totalIran, Islamic Rep.IraqKazakhstanKenyaKuwaitKyrgyz RepublicLao PDRLatin America & Caribbean Latin America & Caribbean (excluding high income)Latin America & the Caribbean (IDA & IBRD countries)Least developed countries: UN classificationLebanonLiberiaLow incomeMacao SAR, ChinaMadagascarMalaysiaMaldivesMaliMarshall IslandsMauritaniaMauritiusMexicoMiddle East & North AfricaMiddle East & North Africa (excluding high income)Middle East & North Africa (IDA & IBRD countries)MoldovaMongoliaMoroccoMyanmarNamibiaNauruNepalNicaraguaNigerOmanOther small statesPacific island small statesPanamaParaguayPre-demographic dividendQatarRwandaSamoaSao Tome and PrincipeSaudi ArabiaSenegalSerbiaSeychellesSierra LeoneSmall statesSolomon IslandsSouth AfricaSouth SudanSt. Kitts and NevisSt. LuciaSt. Vincent and the GrenadinesSub-Saharan Africa Sub-Saharan Africa (excluding high income)Sub-Saharan Africa (IDA & IBRD countries)SurinameSwazilandSyrian Arab RepublicTajikistanTanzaniaTogoTongaTrinidad and TobagoTunisiaTuvaluUnited Arab EmiratesUzbekistanVanuatuVietnamWest Bank and GazaZimbabwe

Linea del tempo:

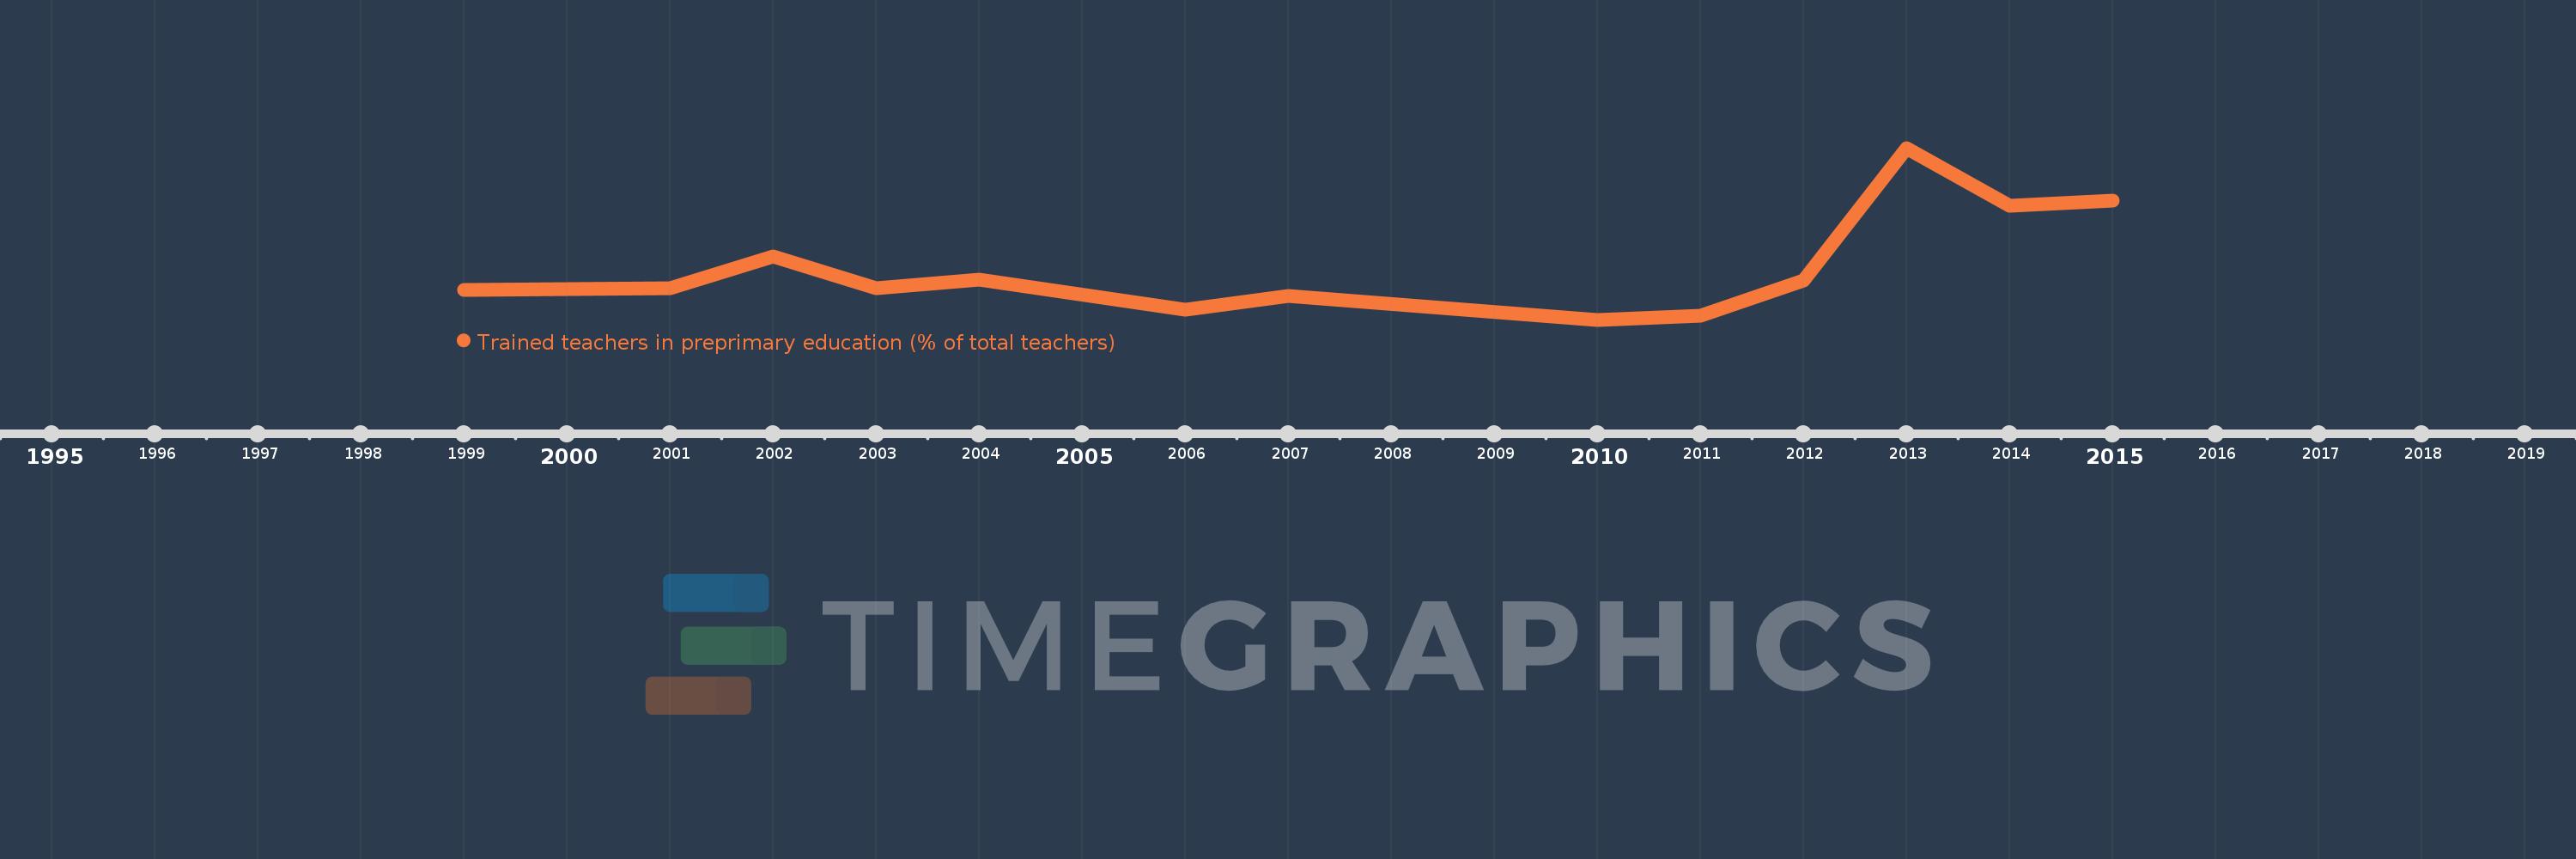
Questa scala temporale mostra un grafico dal 1999 anno al 2015 anno. Maldives. I dati fino ad 1998 anno non disponibili. Il numero di osservazioni attuali secondo i date: 14.

La fonte (nome):

Indicatori dello sviluppo mondiale

La fonte (organizzazione):

United Nations Educational, Scientific, and Cultural Organization (UNESCO) Institute for Statistics.

Categorie:

Education

sono stati aggiornati

23 apr 2017 anni

Indicatori delle variazioni dei valori per anni

In media:
52.865
Minima:
37.838
1 gen 2010 anni
Massimo:
88.723
1 gen 2013 anni
Alla data di osservazione
Valore
Variazione assoluta
La variazione rispetto al valore precedente
1 gen 1999 anni
46.779
+46.779
0.0%
1 gen 2000 anni
47.044
+0.265
0.57%
1 gen 2001 anni
47.202
+0.158
0.34%
1 gen 2002 anni
56.597
+9.395
19.9%
1 gen 2003 anni
47.059
-9.538
-16.85%
1 gen 2004 anni
49.699
+2.641
5.61%
1 gen 2006 anni
40.891
-8.808
-17.72%
1 gen 2007 anni
45.008
+4.117
10.07%
1 gen 2010 anni
37.838
-7.17
-15.93%
1 gen 2011 anni
39.003
+1.165
3.08%
1 gen 2012 anni
49.51
+10.507
26.94%
1 gen 2013 anni
88.723
+39.212
79.2%
1 gen 2014 anni
71.564
-17.159
-19.34%
1 gen 2015 anni
73.197
+1.634
2.28%

Classificazione dei paesi secondo i statistiche attuali per anni