29
/it/
it
AIzaSyAYiBZKx7MnpbEhh9jyipgxe19OcubqV5w
April 1, 2024
238835
Seychelles
SYC
true
2
1
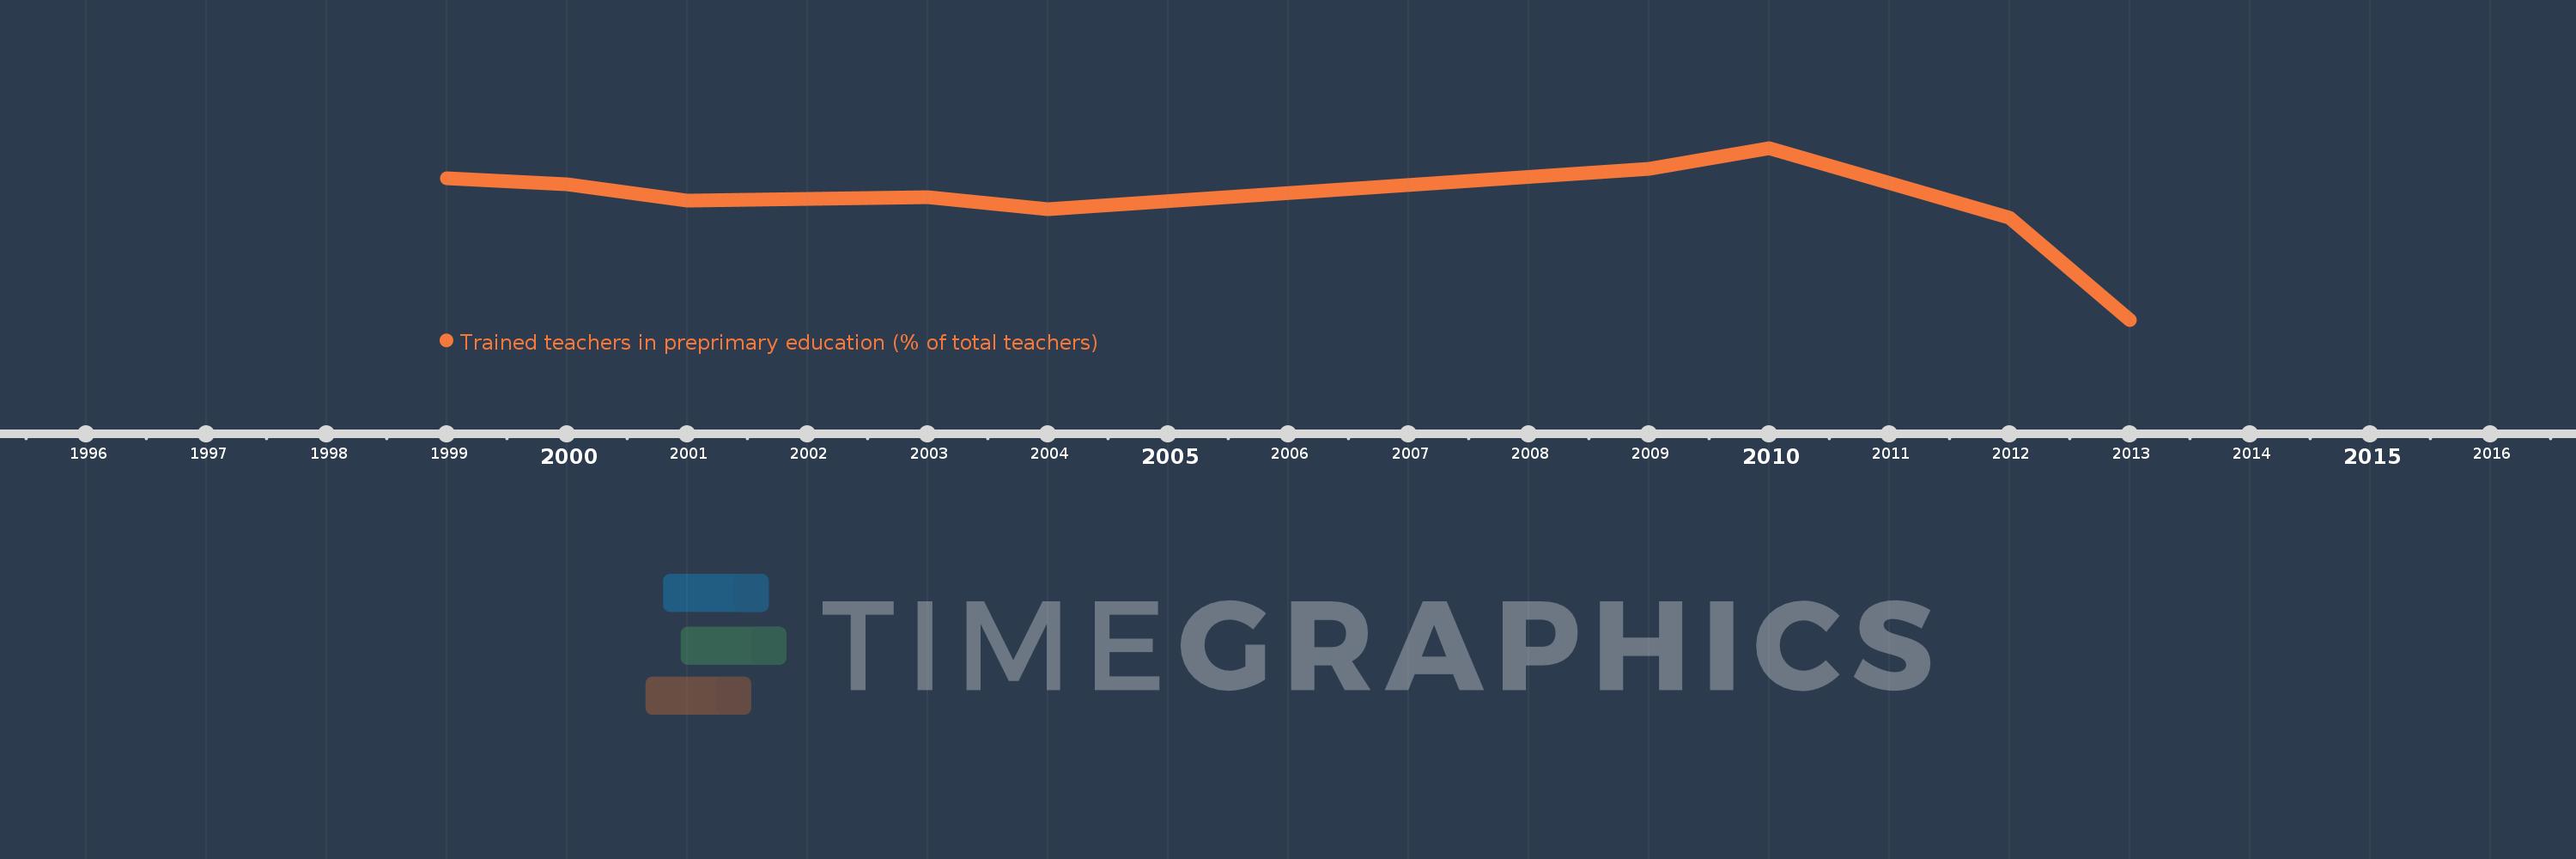
Trained teachers in preprimary education (% of total teachers)
2013,2012,2010,2009,2004,2003,2002,2001,2000,1999
Queste statistiche in altri paesi:
Linea del tempo:
Questa scala temporale mostra un grafico dal 1999 anno al 2013 anno. Seychelles. I dati fino ad 1998 anno non disponibili. Il numero di osservazioni attuali secondo i date: 10.
La fonte (nome):
Indicatori dello sviluppo mondiale
La fonte (organizzazione):
United Nations Educational, Scientific, and Cultural Organization (UNESCO) Institute for Statistics.
Categorie:
Education
sono stati aggiornati
23 apr 2017 anni
Indicatori delle variazioni dei valori per anni
Minima:
35.831
1 gen 2013 anni
Massimo:
99.482
1 gen 2010 anni
Alla data di osservazione
Valore
Variazione assoluta
La variazione rispetto al valore precedente
1 gen 1999 anni
88.144
+88.144
0.0%
1 gen 2000 anni
86.154
-1.99
-2.26%
1 gen 2001 anni
80.097
-6.057
-7.03%
1 gen 2002 anni
80.513
+0.416
0.52%
1 gen 2003 anni
81.188
+0.675
0.84%
1 gen 2004 anni
76.796
-4.393
-5.41%
1 gen 2009 anni
91.748
+14.952
19.47%
1 gen 2010 anni
99.482
+7.734
8.43%
1 gen 2012 anni
73.714
-25.768
-25.9%
1 gen 2013 anni
35.831
-37.884
-51.39%
Classificazione dei paesi secondo i statistiche attuali per anni


Commenti: