Download Queste statistiche in altri paesi:
Linea del tempo:
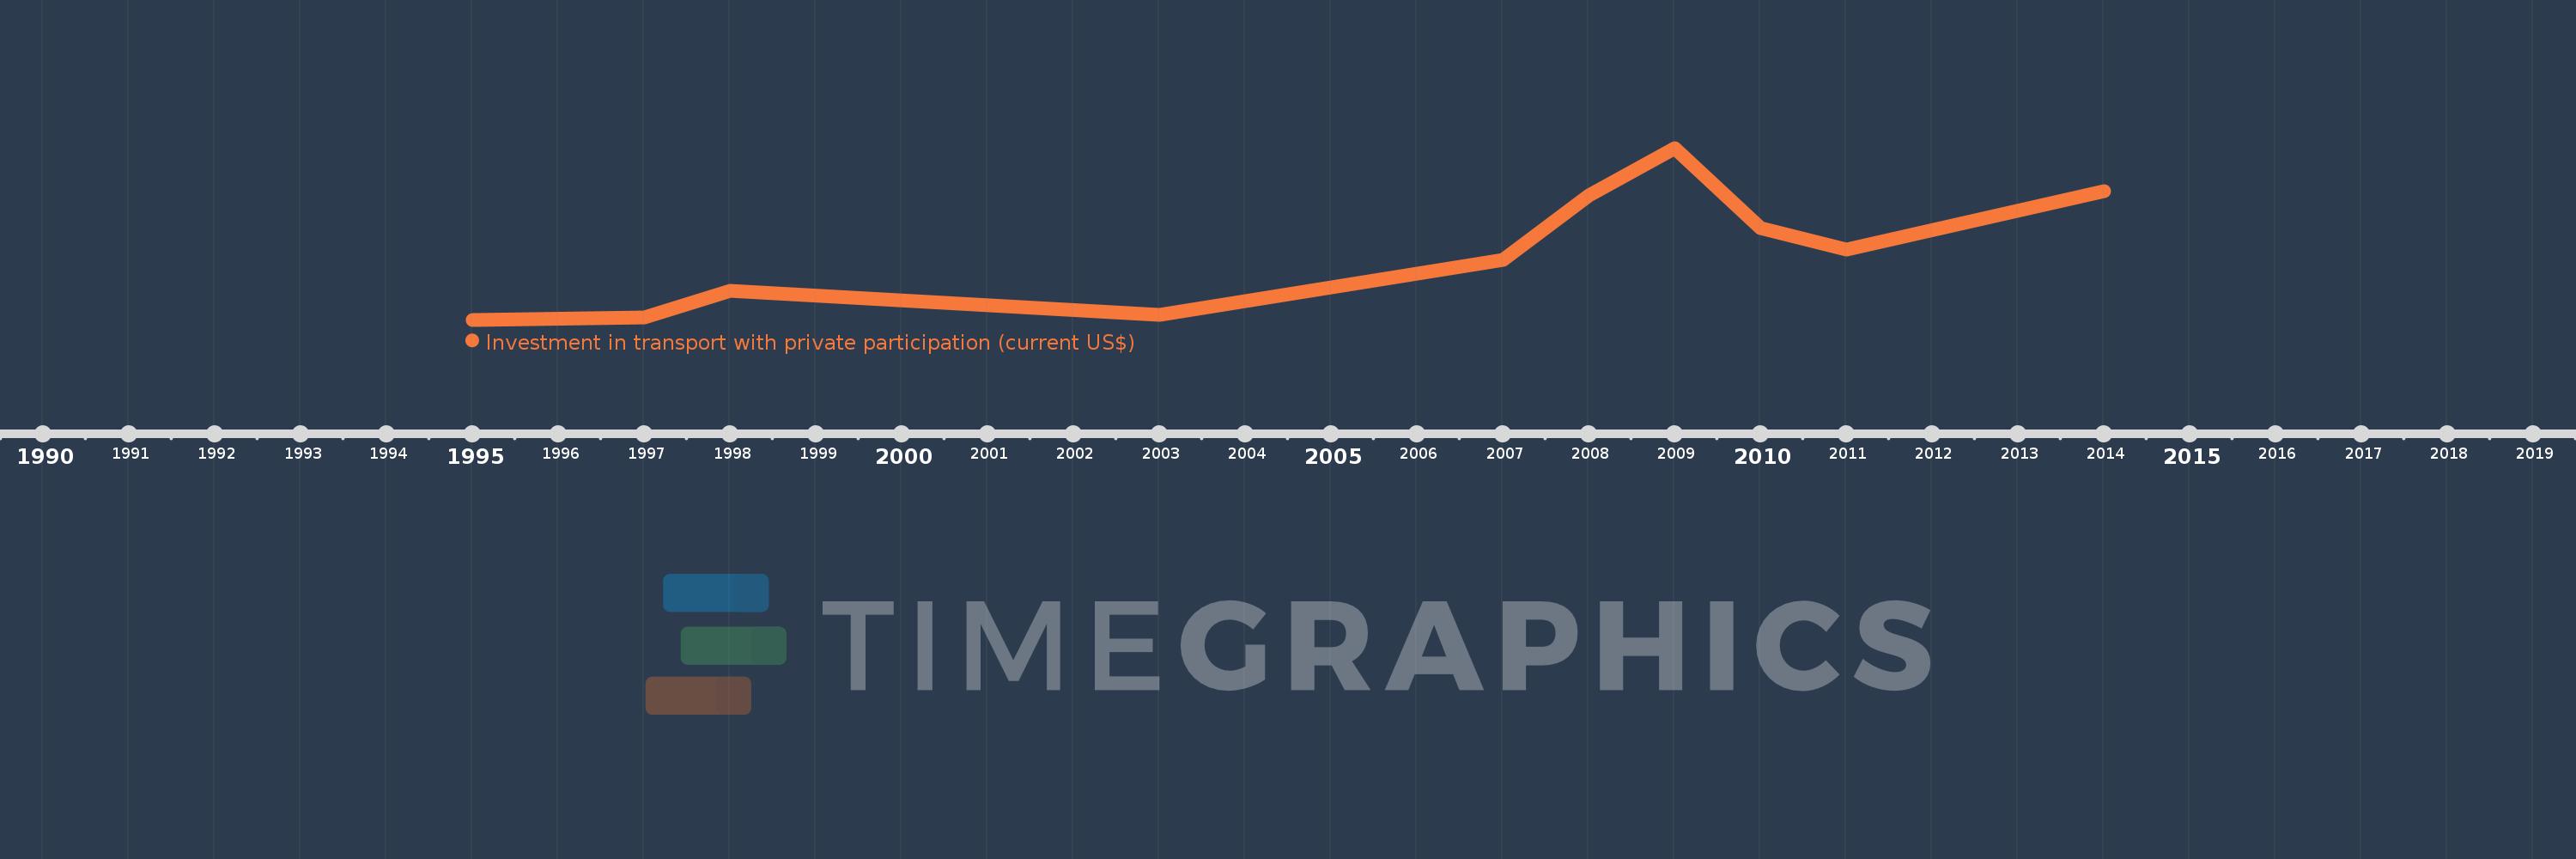
Questa scala temporale mostra un grafico dal 1995 anno al 2014 anno. Vietnam. I dati fino ad 1994 anno non disponibili. Il numero di osservazioni attuali secondo i date: 10.
La fonte (nome):
Indicatori dello sviluppo mondiale
La fonte (organizzazione):
World Bank, Private Participation in Infrastructure Project Database (http://ppi.worldbank.org).
Categorie:
Infrastructure, Private Sector
sono stati aggiornati
23 apr 2017 anni
Indicatori delle variazioni dei valori per anni
Minima:
10.0 Mln
1 gen 1995 anni
Massimo:
365.0 Mln
1 gen 2009 anni
Alla data di osservazione
Valore
Variazione assoluta
La variazione rispetto al valore precedente
1 gen 1995 anni
10.0 Mln
+10.0 Mln
0.0%
1 gen 1997 anni
15.0 Mln
+5.0 Mln
50.0%
1 gen 1998 anni
70.0 Mln
+55.0 Mln
366.67%
1 gen 2003 anni
20.0 Mln
-50.0 Mln
-71.43%
1 gen 2007 anni
133.0 Mln
+113.0 Mln
565.0%
1 gen 2008 anni
267.0 Mln
+134.0 Mln
100.75%
1 gen 2009 anni
365.0 Mln
+98.0 Mln
36.7%
1 gen 2010 anni
200.0 Mln
-165.0 Mln
-45.21%
1 gen 2011 anni
155.0 Mln
-45.0 Mln
-22.5%
1 gen 2014 anni
275.5 Mln
+120.5 Mln
77.74%
Classificazione dei paesi secondo i statistiche attuali per anni
