Download Queste statistiche in altri paesi:
Linea del tempo:
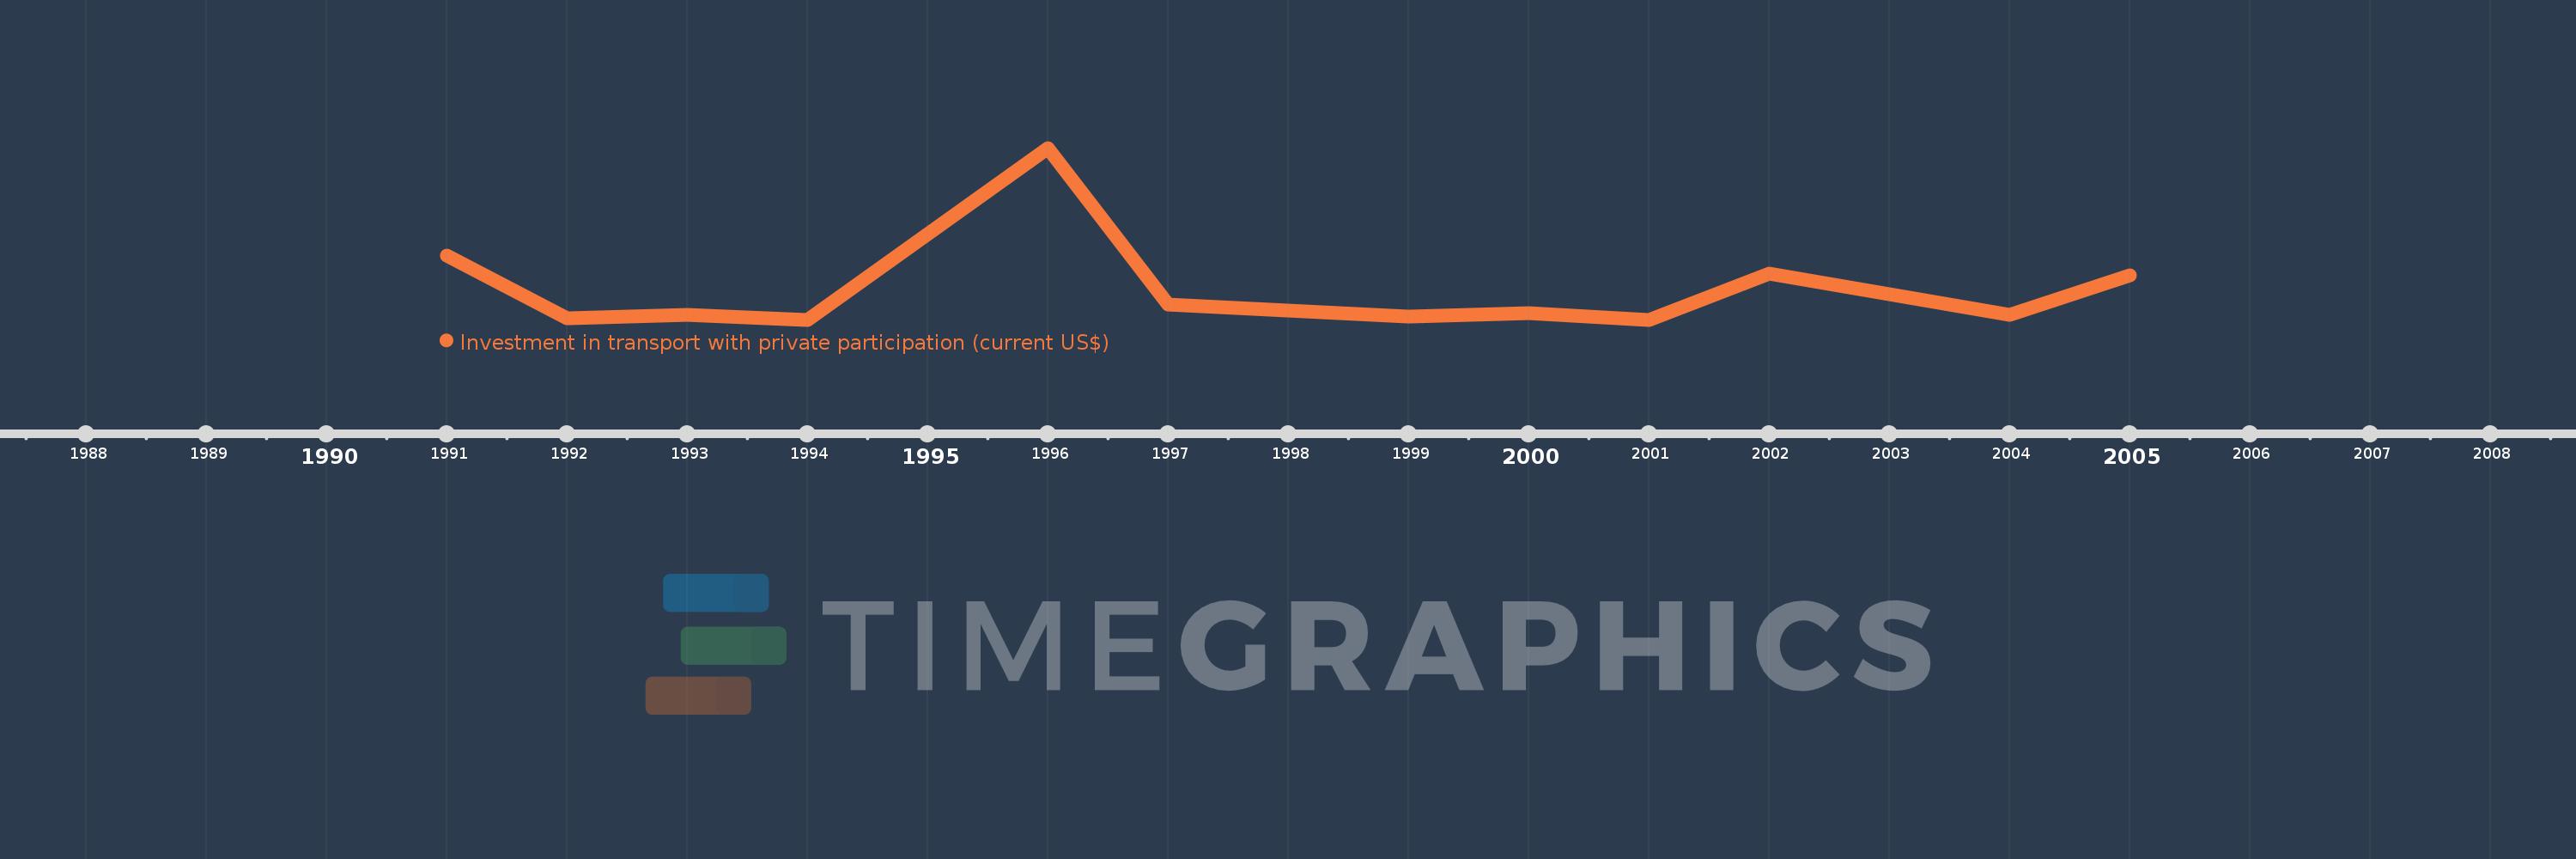
Questa scala temporale mostra un grafico dal 1991 anno al 2005 anno. Thailand. I dati fino ad 1990 anno non disponibili. Il numero di osservazioni attuali secondo i date: 12.
La fonte (nome):
Indicatori dello sviluppo mondiale
La fonte (organizzazione):
World Bank, Private Participation in Infrastructure Project Database (http://ppi.worldbank.org).
Categorie:
Infrastructure, Private Sector
sono stati aggiornati
23 apr 2017 anni
Indicatori delle variazioni dei valori per anni
Minima:
0.0
1 gen 1994 anni
Massimo:
1.7 Mlrd
1 gen 1996 anni
Alla data di osservazione
Valore
Variazione assoluta
La variazione rispetto al valore precedente
1 gen 1991 anni
632.2 Mln
+632.2 Mln
0.0%
1 gen 1992 anni
15.7 Mln
-616.5 Mln
-97.52%
1 gen 1993 anni
48.0 Mln
+32.3 Mln
205.73%
1 gen 1994 anni
0.0
-48.0 Mln
-100.0%
1 gen 1996 anni
1.7 Mlrd
+1.7 Mlrd
%
1 gen 1997 anni
150.0 Mln
-1.55 Mlrd
-91.18%
1 gen 1999 anni
27.4 Mln
-122.6 Mln
-81.73%
1 gen 2000 anni
63.73 Mln
+36.33 Mln
132.59%
1 gen 2001 anni
0.0
-63.73 Mln
-100.0%
1 gen 2002 anni
455.0 Mln
+455.0 Mln
%
1 gen 2004 anni
45.0 Mln
-410.0 Mln
-90.11%
1 gen 2005 anni
439.0 Mln
+394.0 Mln
875.56%
Classificazione dei paesi secondo i statistiche attuali per anni
