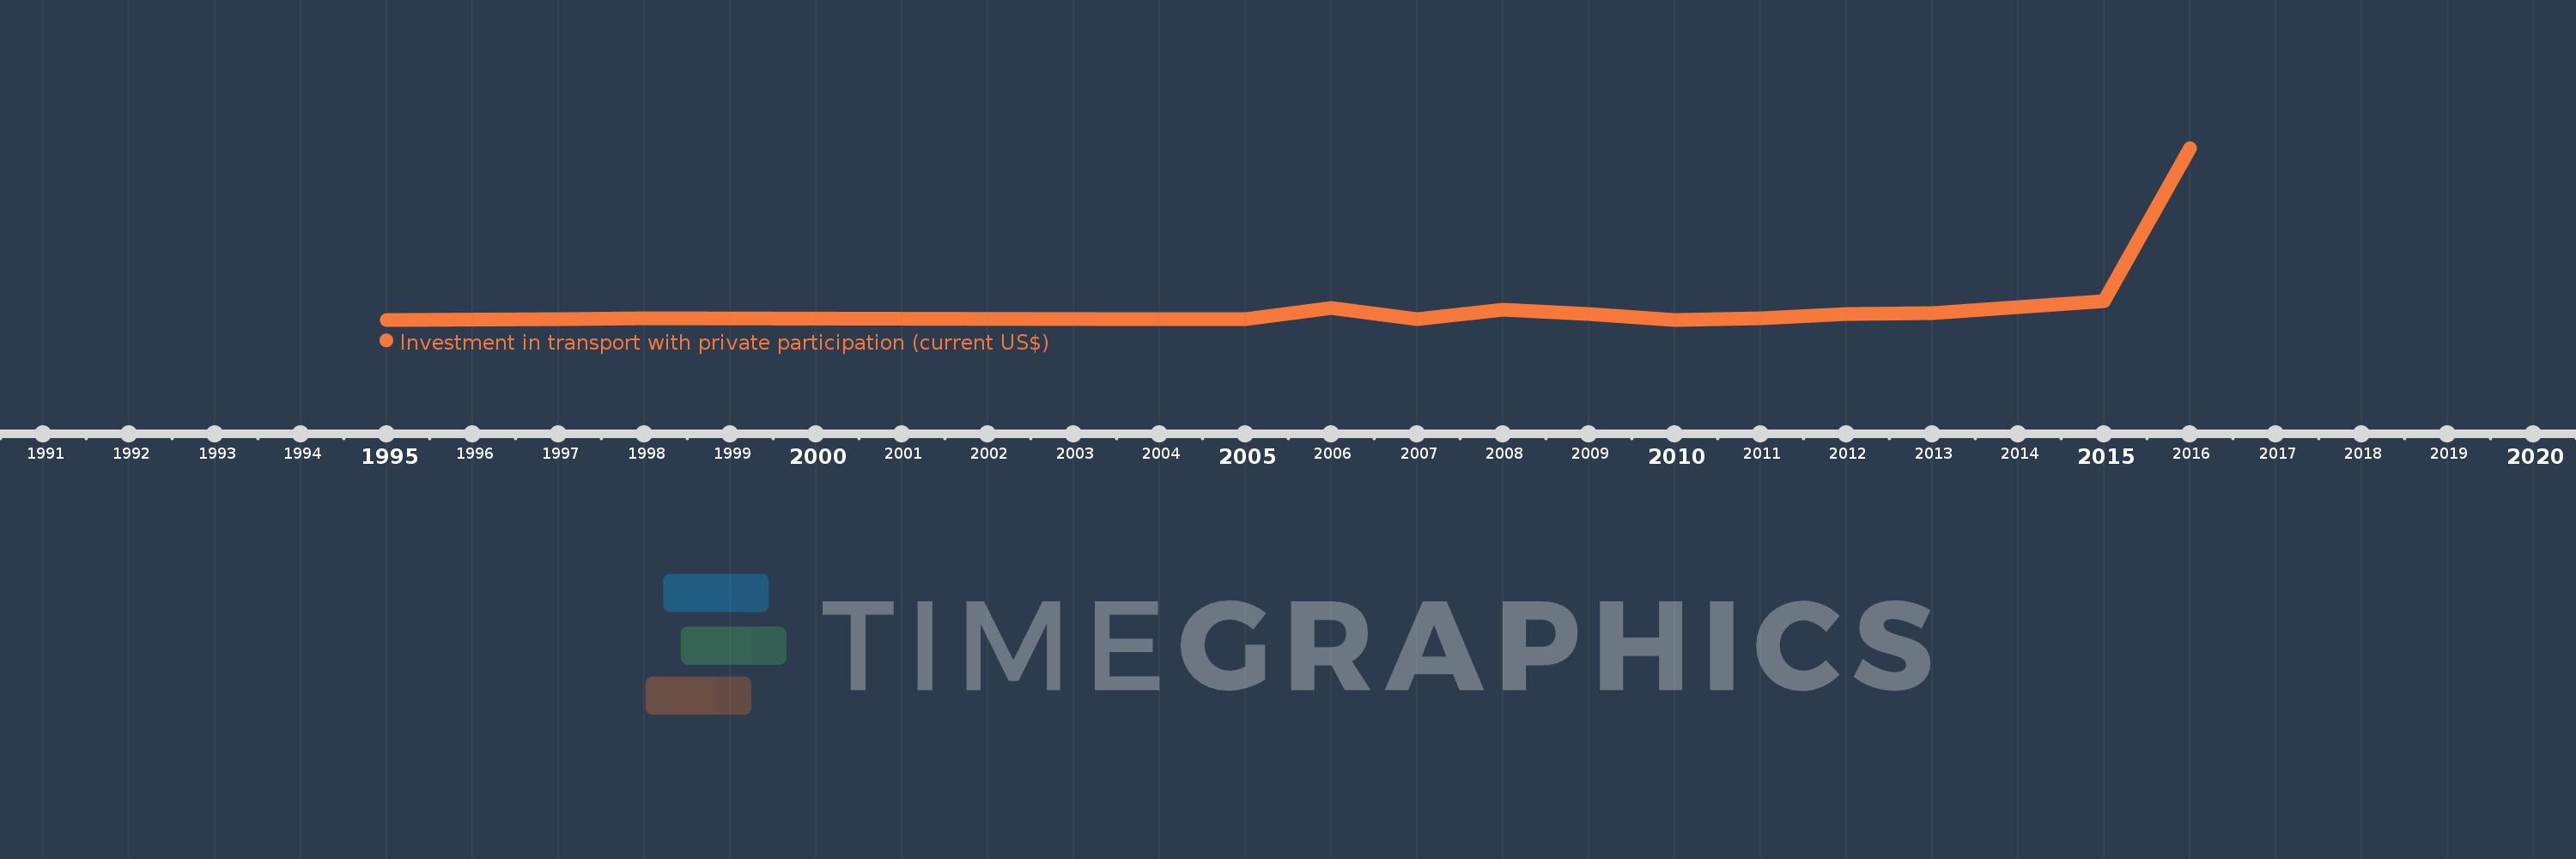
Questa scala temporale mostra un grafico dal 1995 anno al 2016 anno. Turkey. I dati fino ad 1994 anno non disponibili. Il numero di osservazioni attuali secondo i date: 16.
La fonte (nome):
Indicatori dello sviluppo mondiale
La fonte (organizzazione):
World Bank, Private Participation in Infrastructure Project Database (http://ppi.worldbank.org).
Categorie:
Infrastructure, Private Sector
sono stati aggiornati
23 apr 2017 anni
Indicatori delle variazioni dei valori per anni
In media:
3.885 Mlrd
Minima:
0.0
1 gen 2010 anni
Massimo:
43.103 Mlrd
1 gen 2016 anni
Alla data di osservazione
Valore
Variazione assoluta
La variazione rispetto al valore precedente
1 gen 1995 anni
20.0 Mln
+20.0 Mln
0.0%
1 gen 1997 anni
85.0 Mln
+65.0 Mln
325.0%
1 gen 1998 anni
305.0 Mln
+220.0 Mln
258.82%
1 gen 2004 anni
85.0 Mln
-220.0 Mln
-72.13%
1 gen 2005 anni
155.6 Mln
+70.6 Mln
83.06%
1 gen 2006 anni
2.848 Mlrd
+2.693 Mlrd
1.73 Mille.%
1 gen 2007 anni
217.0 Mln
-2.631 Mlrd
-92.38%
1 gen 2008 anni
2.578 Mlrd
+2.361 Mlrd
1.09 Mille.%
1 gen 2009 anni
1.492 Mlrd
-1.087 Mlrd
-42.15%
1 gen 2010 anni
0.0
-1.492 Mlrd
-100.0%
1 gen 2011 anni
332.7 Mln
+332.7 Mln
%
1 gen 2012 anni
1.416 Mlrd
+1.084 Mlrd
325.71%
1 gen 2013 anni
1.562 Mlrd
+145.65 Mln
10.28%
1 gen 2014 anni
3.215 Mlrd
+1.653 Mlrd
105.83%
1 gen 2015 anni
4.743 Mlrd
+1.528 Mlrd
47.54%
1 gen 2016 anni
43.103 Mlrd
+38.36 Mlrd
808.7%
Classificazione dei paesi secondo i statistiche attuali per anni
