29
/it/
it
AIzaSyAYiBZKx7MnpbEhh9jyipgxe19OcubqV5w
April 1, 2024
124989
Egypt, Arab Rep.
EGY
true
2
1
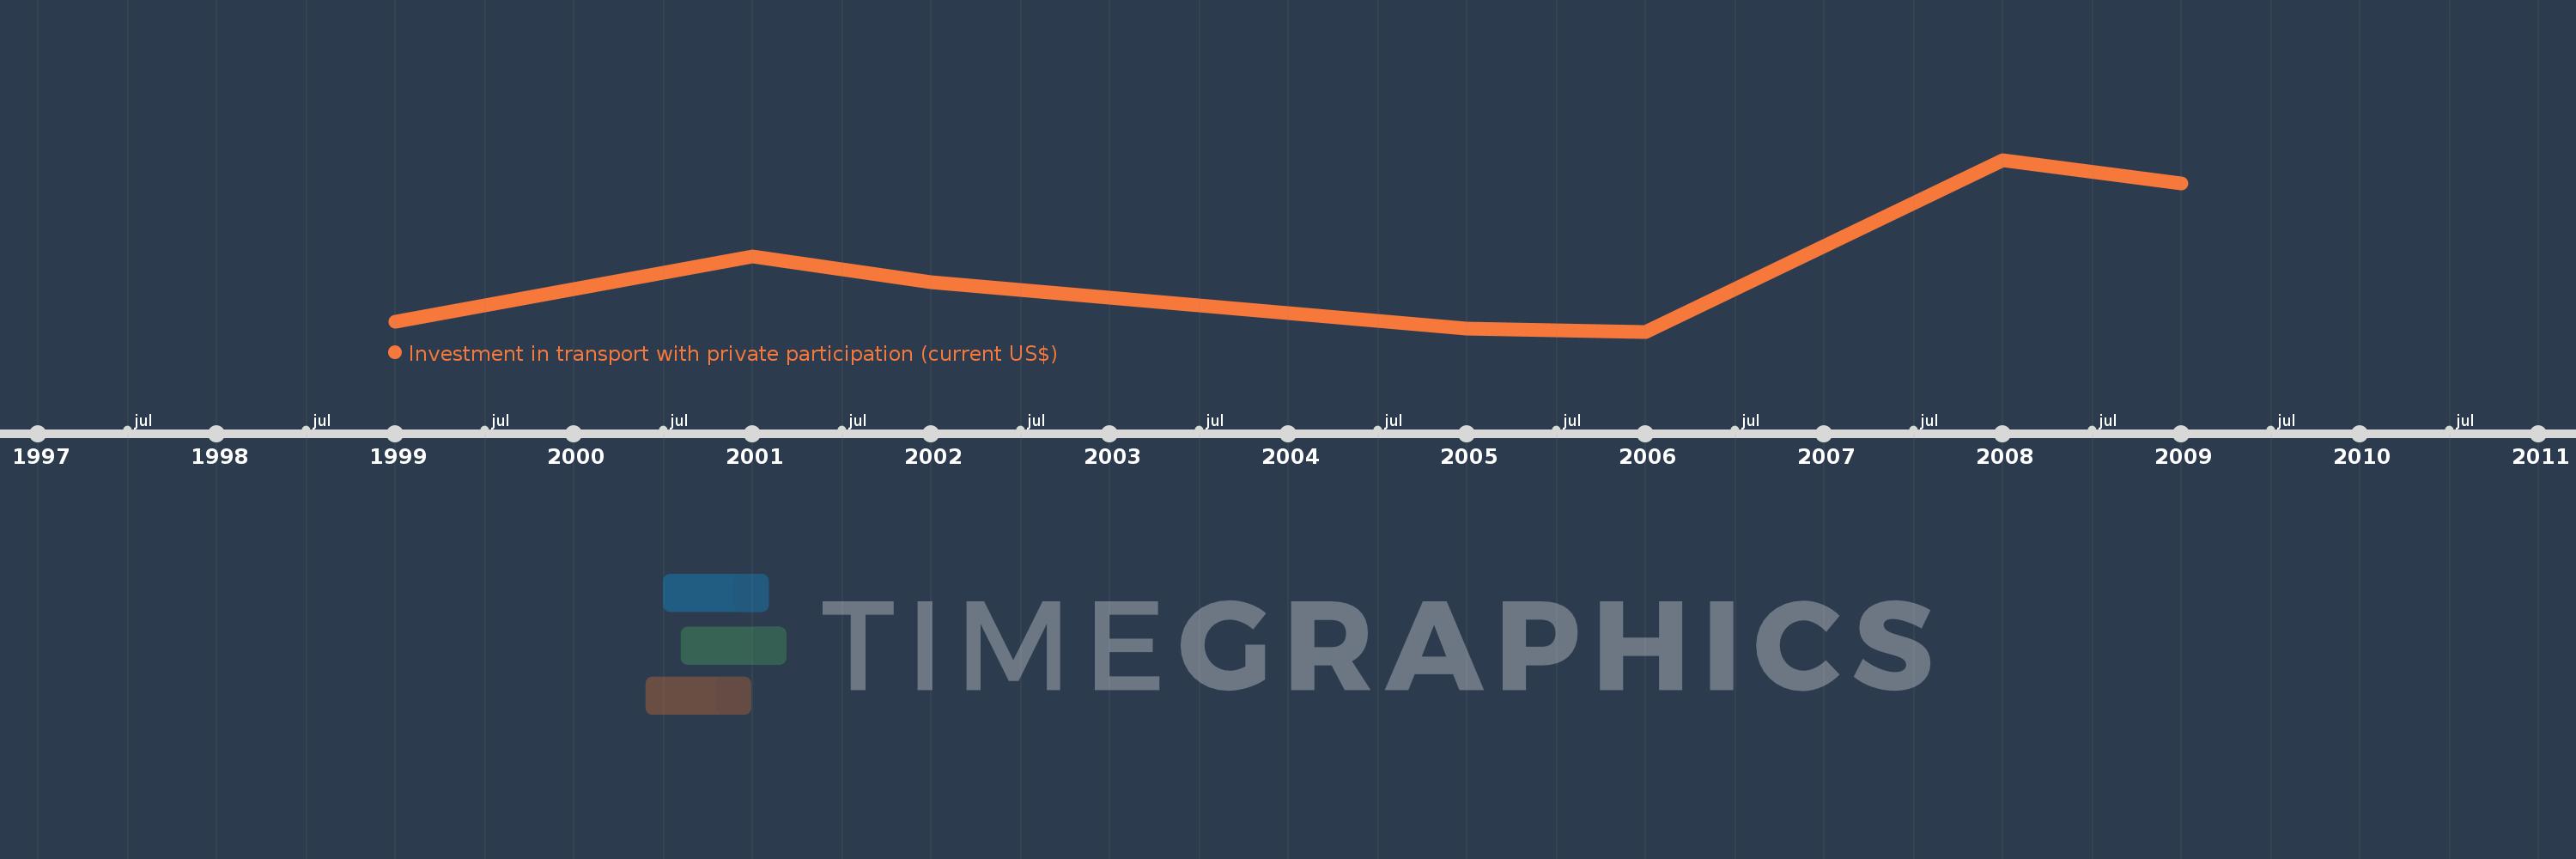
Investment in transport with private participation (current US$)
2009,2008,2006,2005,2002,2001,1999
Queste statistiche in altri paesi:
Linea del tempo:
Questa scala temporale mostra un grafico dal 1999 anno al 2009 anno. Egypt, Arab Rep.. I dati fino ad 1998 anno non disponibili. Il numero di osservazioni attuali secondo i date: 7.
La fonte (nome):
Indicatori dello sviluppo mondiale
La fonte (organizzazione):
World Bank, Private Participation in Infrastructure Project Database (http://ppi.worldbank.org).
Categorie:
Infrastructure, Private Sector
sono stati aggiornati
23 apr 2017 anni
Indicatori delle variazioni dei valori per anni
Minima:
86.2 Mln
1 gen 2006 anni
Massimo:
730.0 Mln
1 gen 2008 anni
Alla data di osservazione
Valore
Variazione assoluta
La variazione rispetto al valore precedente
1 gen 1999 anni
123.9 Mln
+123.9 Mln
0.0%
1 gen 2001 anni
368.3 Mln
+244.4 Mln
197.26%
1 gen 2002 anni
270.0 Mln
-98.3 Mln
-26.69%
1 gen 2005 anni
97.0 Mln
-173.0 Mln
-64.07%
1 gen 2006 anni
86.2 Mln
-10.8 Mln
-11.13%
1 gen 2008 anni
730.0 Mln
+643.8 Mln
746.87%
1 gen 2009 anni
640.0 Mln
-90.0 Mln
-12.33%
Classificazione dei paesi secondo i statistiche attuali per anni


Commenti: