29
/it/
it
AIzaSyAYiBZKx7MnpbEhh9jyipgxe19OcubqV5w
April 1, 2024
269633
Turkey
TUR
true
2
1
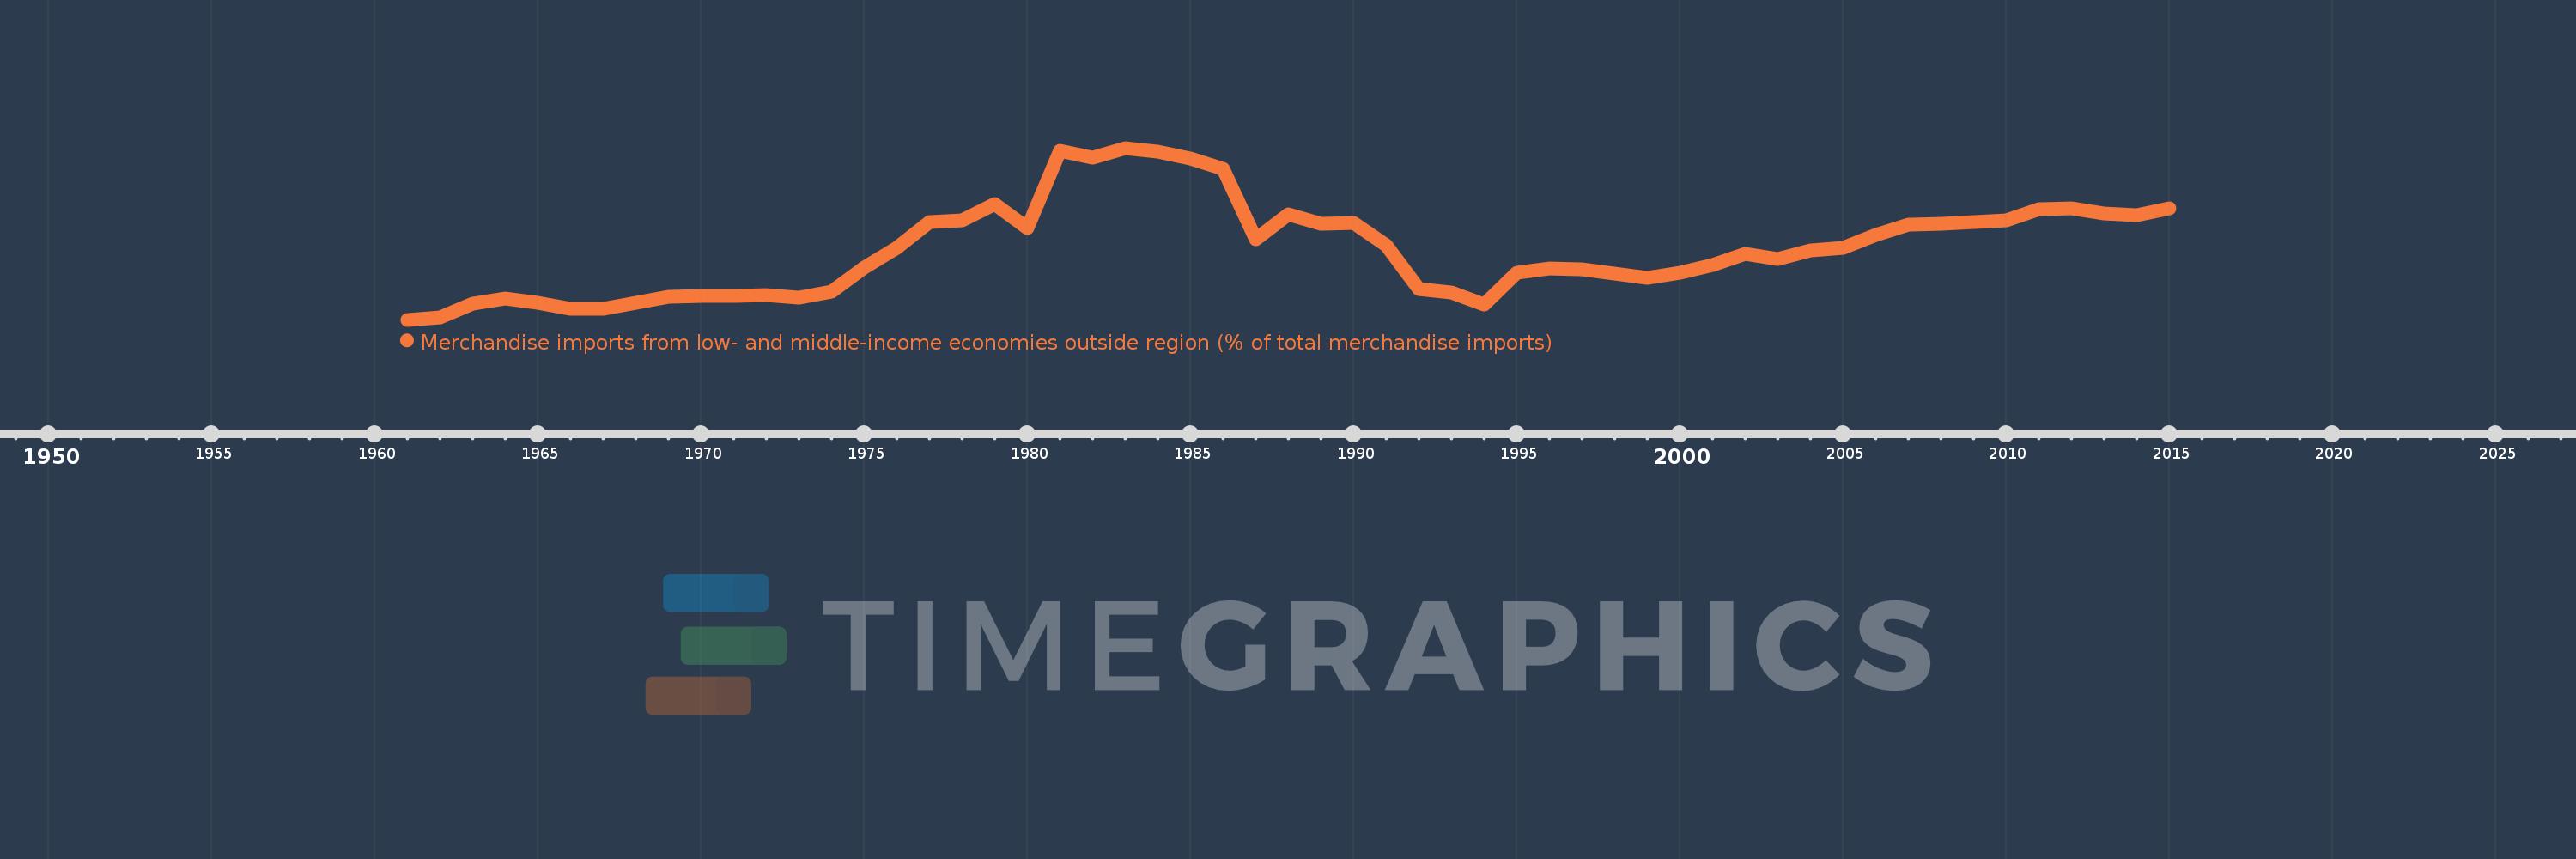
Merchandise imports from low- and middle-income economies outside region (% of total merchandise imports)
2015,2014,2013,2012,2011,2010,2009,2008,2007,2006,2005,2004,2003,2002,2001,2000,1999,1998,1997,1996,1995,1994,1993,1992,1991,1990,1989,1988,1987,1986,1985,1984,1983,1982,1981,1980,1979,1978,1977,1976,1975,1974,1973,1972,1971,1970,1969,1968,1967,1966,1965,1964,1963,1962,1961
Queste statistiche in altri paesi:
AfghanistanAlbaniaAlgeriaAngolaArab WorldArgentinaArmeniaArubaAustraliaAustriaAzerbaijanBahamas, TheBahrainBangladeshBarbadosBelarusBelgiumBelizeBeninBermudaBoliviaBrazilBrunei DarussalamBulgariaBurkina FasoBurundiCabo VerdeCambodiaCameroonCanadaCaribbean small statesCentral African RepublicCentral Europe and the BalticsChileChinaColombiaCongo, Dem. Rep.Congo, Rep.Costa RicaCote d'IvoireCroatiaCubaCyprusCzech RepublicDenmarkDominicaDominican RepublicEarly-demographic dividendEast Asia & PacificEast Asia & Pacific (excluding high income)East Asia & Pacific (IDA & IBRD countries)EcuadorEgypt, Arab Rep.El SalvadorEstoniaEthiopiaEuro areaEurope & Central AsiaEurope & Central Asia (excluding high income)Europe & Central Asia (IDA & IBRD countries)European UnionFijiFinlandFragile and conflict affected situationsFranceGabonGambia, TheGeorgiaGermanyGhanaGreeceGreenlandGrenadaGuatemalaGuineaGuyanaHaitiHeavily indebted poor countries (HIPC)High incomeHondurasHong Kong SAR, ChinaHungaryIBRD onlyIcelandIDA & IBRD totalIDA blendIDA onlyIDA totalIndiaIndonesiaIran, Islamic Rep.IraqIrelandIsraelItalyJamaicaJapanJordanKazakhstanKenyaKorea, Dem. People’s Rep.Korea, Rep.KuwaitKyrgyz RepublicLao PDRLate-demographic dividendLatin America & Caribbean Latin America & Caribbean (excluding high income)Latin America & the Caribbean (IDA & IBRD countries)LatviaLeast developed countries: UN classificationLebanonLiberiaLibyaLithuaniaLow & middle incomeLow incomeLower middle incomeLuxembourgMacao SAR, ChinaMacedonia, FYRMadagascarMalawiMalaysiaMaliMaltaMauritaniaMauritiusMexicoMiddle East & North AfricaMiddle East & North Africa (excluding high income)Middle East & North Africa (IDA & IBRD countries)Middle incomeMoldovaMongoliaMontenegroMoroccoMozambiqueMyanmarNetherlandsNew CaledoniaNew ZealandNicaraguaNigerNigeriaNorth AmericaNorwayOECD membersOmanOther small statesPacific island small statesPakistanPanamaPapua New GuineaParaguayPeruPhilippinesPolandPortugalPost-demographic dividendPre-demographic dividendQatarRomaniaRussian FederationRwandaSaudi ArabiaSenegalSerbiaSeychellesSierra LeoneSingaporeSlovak RepublicSloveniaSmall statesSomaliaSouth AfricaSouth AsiaSouth Asia (IDA & IBRD)SpainSri LankaSt. Kitts and NevisSt. LuciaSt. Vincent and the GrenadinesSub-Saharan Africa Sub-Saharan Africa (excluding high income)Sub-Saharan Africa (IDA & IBRD countries)SudanSurinameSwedenSwitzerlandSyrian Arab RepublicTanzaniaThailandTogoTrinidad and TobagoTunisiaTurkeyUgandaUkraineUnited Arab EmiratesUnited KingdomUnited StatesUpper middle incomeUruguayVenezuela, RBVietnamWorldYemen, Rep.ZambiaZimbabwe Linea del tempo:
Questa scala temporale mostra un grafico dal 1961 anno al 2015 anno. Turkey. I dati fino ad 1960 anno non disponibili. Il numero di osservazioni attuali secondo i date: 55.
La fonte (nome):
Indicatori dello sviluppo mondiale
La fonte (organizzazione):
World Bank staff estimates based data from International Monetary Fund's Direction of Trade database.
Categorie:
Private Sector, Trade
sono stati aggiornati
23 apr 2017 anni
Indicatori delle variazioni dei valori per anni
Minima:
2.074
1 gen 1961 anni
Massimo:
37.623
1 gen 1983 anni
Alla data di osservazione
Valore
Variazione assoluta
La variazione rispetto al valore precedente
1 gen 1961 anni
2.074
+2.074
0.0%
1 gen 1962 anni
2.496
+0.422
20.35%
1 gen 1963 anni
5.474
+2.978
119.3%
1 gen 1964 anni
6.429
+0.955
17.44%
1 gen 1965 anni
5.574
-0.855
-13.29%
1 gen 1966 anni
4.326
-1.248
-22.39%
1 gen 1967 anni
4.335
+0.009
0.21%
1 gen 1968 anni
5.662
+1.327
30.6%
1 gen 1969 anni
6.867
+1.205
21.28%
1 gen 1970 anni
6.944
+0.078
1.13%
1 gen 1971 anni
7.017
+0.073
1.05%
1 gen 1972 anni
7.158
+0.142
2.02%
1 gen 1973 anni
6.594
-0.565
-7.89%
1 gen 1974 anni
7.948
+1.354
20.54%
1 gen 1975 anni
12.936
+4.988
62.76%
1 gen 1976 anni
16.918
+3.983
30.79%
1 gen 1977 anni
22.352
+5.434
32.12%
1 gen 1978 anni
22.606
+0.254
1.14%
1 gen 1979 anni
25.954
+3.348
14.81%
1 gen 1980 anni
21.124
-4.83
-18.61%
1 gen 1981 anni
37.056
+15.931
75.42%
1 gen 1982 anni
35.681
-1.375
-3.71%
1 gen 1983 anni
37.623
+1.942
5.44%
1 gen 1984 anni
36.933
-0.689
-1.83%
1 gen 1985 anni
35.482
-1.451
-3.93%
1 gen 1986 anni
33.246
-2.236
-6.3%
1 gen 1987 anni
18.748
-14.498
-43.61%
1 gen 1988 anni
23.837
+5.089
27.14%
1 gen 1989 anni
21.923
-1.914
-8.03%
1 gen 1990 anni
22.052
+0.129
0.59%
1 gen 1991 anni
17.495
-4.557
-20.67%
1 gen 1992 anni
8.403
-9.092
-51.97%
1 gen 1993 anni
7.744
-0.658
-7.84%
1 gen 1994 anni
5.205
-2.539
-32.79%
1 gen 1995 anni
11.836
+6.631
127.38%
1 gen 1996 anni
12.767
+0.931
7.87%
1 gen 1997 anni
12.466
-0.301
-2.36%
1 gen 1998 anni
11.706
-0.76
-6.1%
1 gen 1999 anni
10.812
-0.894
-7.64%
1 gen 2000 anni
11.848
+1.036
9.58%
1 gen 2001 anni
13.325
+1.477
12.47%
1 gen 2002 anni
15.739
+2.414
18.11%
1 gen 2003 anni
14.645
-1.095
-6.95%
1 gen 2004 anni
16.364
+1.72
11.74%
1 gen 2005 anni
16.997
+0.632
3.86%
1 gen 2006 anni
19.588
+2.592
15.25%
1 gen 2007 anni
21.786
+2.198
11.22%
1 gen 2008 anni
21.903
+0.116
0.53%
1 gen 2009 anni
22.209
+0.306
1.4%
1 gen 2010 anni
22.713
+0.504
2.27%
1 gen 2011 anni
24.866
+2.153
9.48%
1 gen 2012 anni
25.084
+0.218
0.88%
1 gen 2013 anni
23.988
-1.096
-4.37%
1 gen 2014 anni
23.736
-0.252
-1.05%
1 gen 2015 anni
25.083
+1.347
5.67%
Classificazione dei paesi secondo i statistiche attuali per anni


Commenti: