29
/it/
it
AIzaSyAYiBZKx7MnpbEhh9jyipgxe19OcubqV5w
April 1, 2024
159679
Ireland
IRL
true
2
1
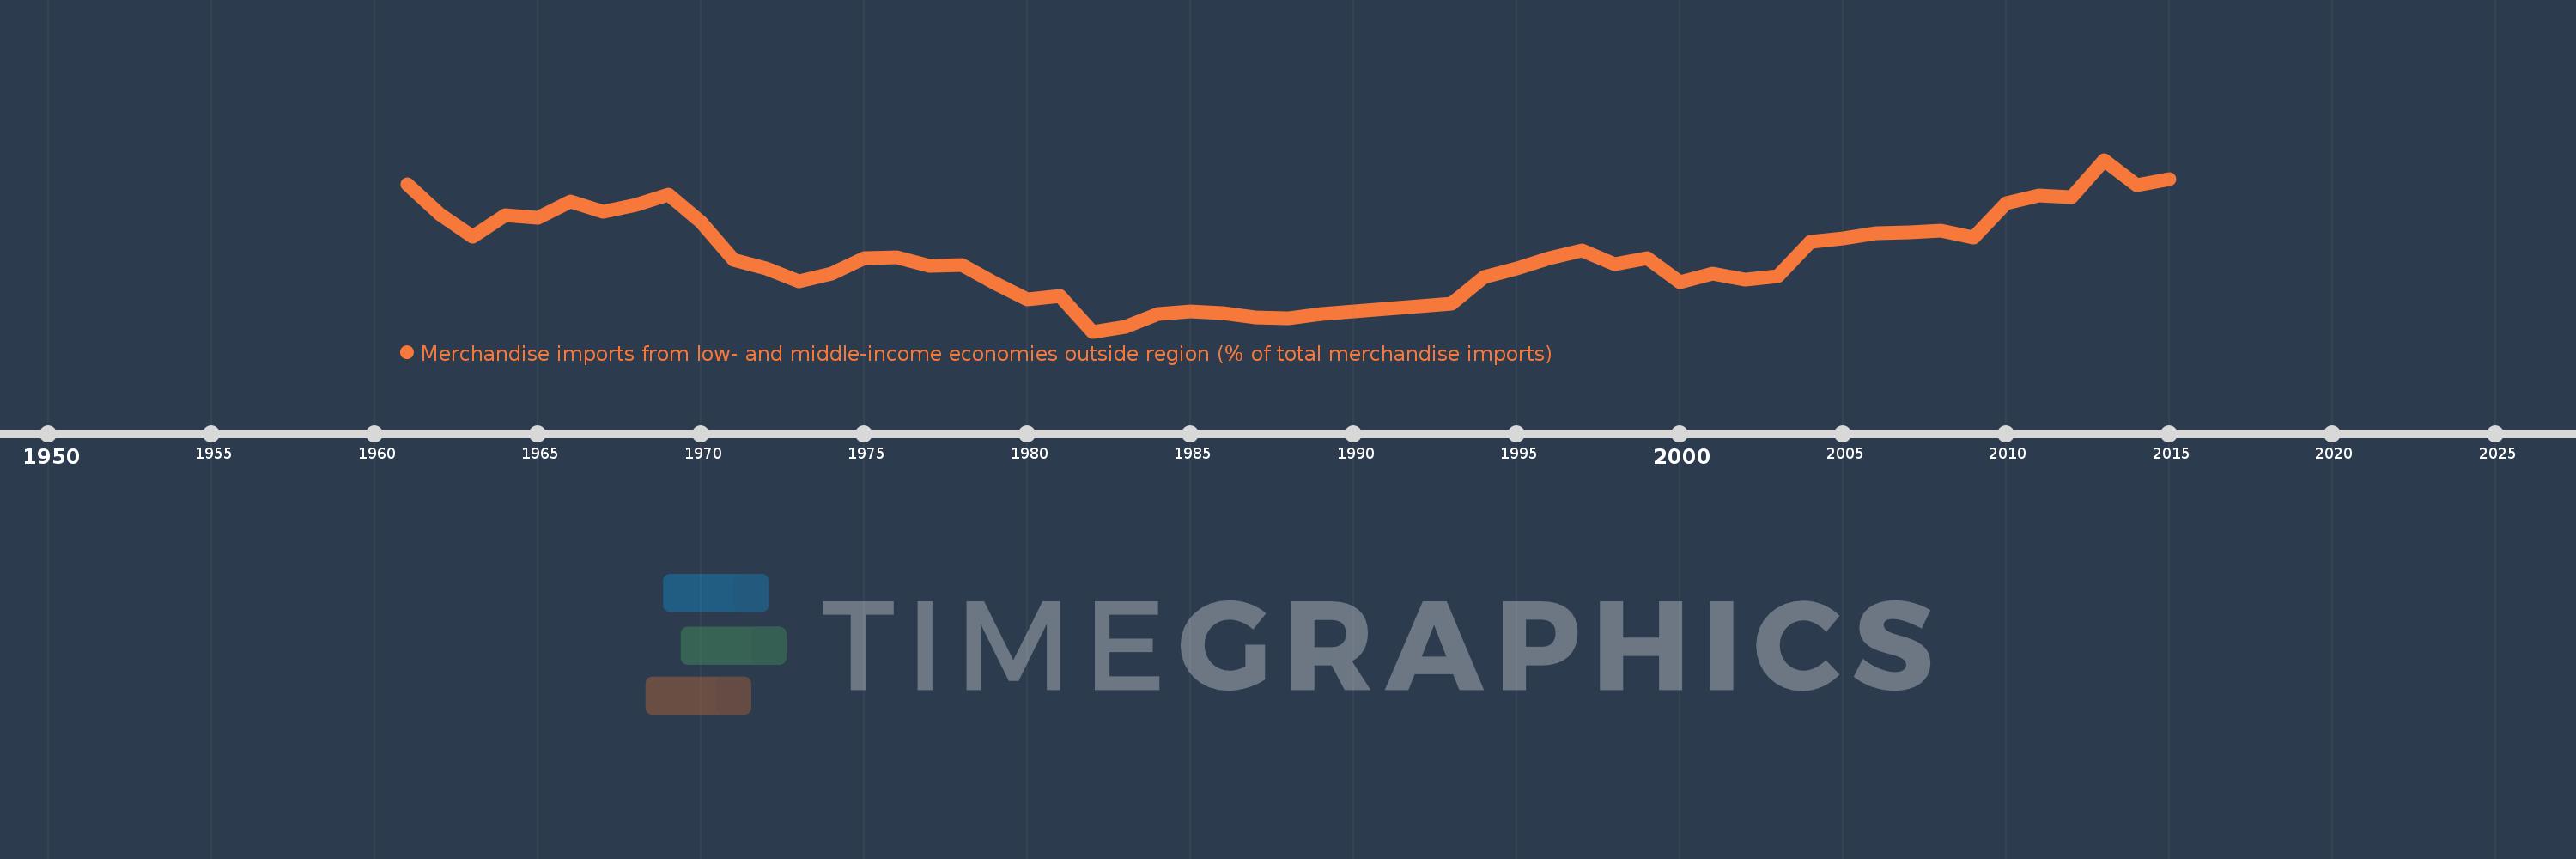
Merchandise imports from low- and middle-income economies outside region (% of total merchandise imports)
2015,2014,2013,2012,2011,2010,2009,2008,2007,2006,2005,2004,2003,2002,2001,2000,1999,1998,1997,1996,1995,1994,1993,1992,1991,1990,1989,1988,1987,1986,1985,1984,1983,1982,1981,1980,1979,1978,1977,1976,1975,1974,1973,1972,1971,1970,1969,1968,1967,1966,1965,1964,1963,1962,1961
Queste statistiche in altri paesi:
AfghanistanAlbaniaAlgeriaAngolaArab WorldArgentinaArmeniaArubaAustraliaAustriaAzerbaijanBahamas, TheBahrainBangladeshBarbadosBelarusBelgiumBelizeBeninBermudaBoliviaBrazilBrunei DarussalamBulgariaBurkina FasoBurundiCabo VerdeCambodiaCameroonCanadaCaribbean small statesCentral African RepublicCentral Europe and the BalticsChileChinaColombiaCongo, Dem. Rep.Congo, Rep.Costa RicaCote d'IvoireCroatiaCubaCyprusCzech RepublicDenmarkDominicaDominican RepublicEarly-demographic dividendEast Asia & PacificEast Asia & Pacific (excluding high income)East Asia & Pacific (IDA & IBRD countries)EcuadorEgypt, Arab Rep.El SalvadorEstoniaEthiopiaEuro areaEurope & Central AsiaEurope & Central Asia (excluding high income)Europe & Central Asia (IDA & IBRD countries)European UnionFijiFinlandFragile and conflict affected situationsFranceGabonGambia, TheGeorgiaGermanyGhanaGreeceGreenlandGrenadaGuatemalaGuineaGuyanaHaitiHeavily indebted poor countries (HIPC)High incomeHondurasHong Kong SAR, ChinaHungaryIBRD onlyIcelandIDA & IBRD totalIDA blendIDA onlyIDA totalIndiaIndonesiaIran, Islamic Rep.IraqIrelandIsraelItalyJamaicaJapanJordanKazakhstanKenyaKorea, Dem. People’s Rep.Korea, Rep.KuwaitKyrgyz RepublicLao PDRLate-demographic dividendLatin America & Caribbean Latin America & Caribbean (excluding high income)Latin America & the Caribbean (IDA & IBRD countries)LatviaLeast developed countries: UN classificationLebanonLiberiaLibyaLithuaniaLow & middle incomeLow incomeLower middle incomeLuxembourgMacao SAR, ChinaMacedonia, FYRMadagascarMalawiMalaysiaMaliMaltaMauritaniaMauritiusMexicoMiddle East & North AfricaMiddle East & North Africa (excluding high income)Middle East & North Africa (IDA & IBRD countries)Middle incomeMoldovaMongoliaMontenegroMoroccoMozambiqueMyanmarNetherlandsNew CaledoniaNew ZealandNicaraguaNigerNigeriaNorth AmericaNorwayOECD membersOmanOther small statesPacific island small statesPakistanPanamaPapua New GuineaParaguayPeruPhilippinesPolandPortugalPost-demographic dividendPre-demographic dividendQatarRomaniaRussian FederationRwandaSaudi ArabiaSenegalSerbiaSeychellesSierra LeoneSingaporeSlovak RepublicSloveniaSmall statesSomaliaSouth AfricaSouth AsiaSouth Asia (IDA & IBRD)SpainSri LankaSt. Kitts and NevisSt. LuciaSt. Vincent and the GrenadinesSub-Saharan Africa Sub-Saharan Africa (excluding high income)Sub-Saharan Africa (IDA & IBRD countries)SudanSurinameSwedenSwitzerlandSyrian Arab RepublicTanzaniaThailandTogoTrinidad and TobagoTunisiaTurkeyUgandaUkraineUnited Arab EmiratesUnited KingdomUnited StatesUpper middle incomeUruguayVenezuela, RBVietnamWorldYemen, Rep.ZambiaZimbabwe Linea del tempo:
Questa scala temporale mostra un grafico dal 1961 anno al 2015 anno. Ireland. I dati fino ad 1960 anno non disponibili. Il numero di osservazioni attuali secondo i date: 55.
La fonte (nome):
Indicatori dello sviluppo mondiale
La fonte (organizzazione):
World Bank staff estimates based data from International Monetary Fund's Direction of Trade database.
Categorie:
Private Sector, Trade
sono stati aggiornati
23 apr 2017 anni
Indicatori delle variazioni dei valori per anni
Minima:
2.761
1 gen 1982 anni
Massimo:
10.39
1 gen 2013 anni
Alla data di osservazione
Valore
Variazione assoluta
La variazione rispetto al valore precedente
1 gen 1961 anni
9.303
+9.303
0.0%
1 gen 1962 anni
7.958
-1.345
-14.46%
1 gen 1963 anni
6.981
-0.977
-12.28%
1 gen 1964 anni
7.92
+0.939
13.45%
1 gen 1965 anni
7.812
-0.107
-1.36%
1 gen 1966 anni
8.527
+0.715
9.15%
1 gen 1967 anni
8.074
-0.453
-5.31%
1 gen 1968 anni
8.378
+0.304
3.77%
1 gen 1969 anni
8.828
+0.449
5.36%
1 gen 1970 anni
7.622
-1.205
-13.65%
1 gen 1971 anni
5.931
-1.692
-22.19%
1 gen 1972 anni
5.555
-0.375
-6.33%
1 gen 1973 anni
4.974
-0.582
-10.47%
1 gen 1974 anni
5.317
+0.343
6.89%
1 gen 1975 anni
6.038
+0.722
13.58%
1 gen 1976 anni
6.071
+0.033
0.54%
1 gen 1977 anni
5.685
-0.386
-6.36%
1 gen 1978 anni
5.703
+0.018
0.32%
1 gen 1979 anni
4.915
-0.788
-13.82%
1 gen 1980 anni
4.18
-0.735
-14.95%
1 gen 1981 anni
4.332
+0.151
3.62%
1 gen 1982 anni
2.761
-1.571
-36.26%
1 gen 1983 anni
2.982
+0.221
8.01%
1 gen 1984 anni
3.54
+0.558
18.7%
1 gen 1985 anni
3.667
+0.126
3.57%
1 gen 1986 anni
3.567
-0.099
-2.71%
1 gen 1987 anni
3.397
-0.17
-4.78%
1 gen 1988 anni
3.371
-0.026
-0.77%
1 gen 1989 anni
3.549
+0.179
5.3%
1 gen 1990 anni
3.668
+0.118
3.33%
1 gen 1991 anni
3.788
+0.12
3.27%
1 gen 1992 anni
3.884
+0.096
2.54%
1 gen 1993 anni
3.995
+0.111
2.86%
1 gen 1994 anni
5.188
+1.193
29.85%
1 gen 1995 anni
5.579
+0.391
7.54%
1 gen 1996 anni
6.034
+0.455
8.16%
1 gen 1997 anni
6.353
+0.319
5.29%
1 gen 1998 anni
5.773
-0.581
-9.14%
1 gen 1999 anni
6.006
+0.233
4.04%
1 gen 2000 anni
4.954
-1.052
-17.51%
1 gen 2001 anni
5.326
+0.372
7.51%
1 gen 2002 anni
5.068
-0.258
-4.85%
1 gen 2003 anni
5.24
+0.173
3.4%
1 gen 2004 anni
6.737
+1.496
28.56%
1 gen 2005 anni
6.909
+0.172
2.56%
1 gen 2006 anni
7.129
+0.22
3.18%
1 gen 2007 anni
7.17
+0.041
0.57%
1 gen 2008 anni
7.246
+0.076
1.06%
1 gen 2009 anni
6.956
-0.29
-4.0%
1 gen 2010 anni
8.451
+1.496
21.5%
1 gen 2011 anni
8.796
+0.345
4.08%
1 gen 2012 anni
8.725
-0.071
-0.8%
1 gen 2013 anni
10.39
+1.664
19.07%
1 gen 2014 anni
9.252
-1.138
-10.95%
1 gen 2015 anni
9.536
+0.284
3.07%
Classificazione dei paesi secondo i statistiche attuali per anni


Commenti: