29
/it/
it
AIzaSyAYiBZKx7MnpbEhh9jyipgxe19OcubqV5w
April 1, 2024
208205
Netherlands
NLD
true
2
1
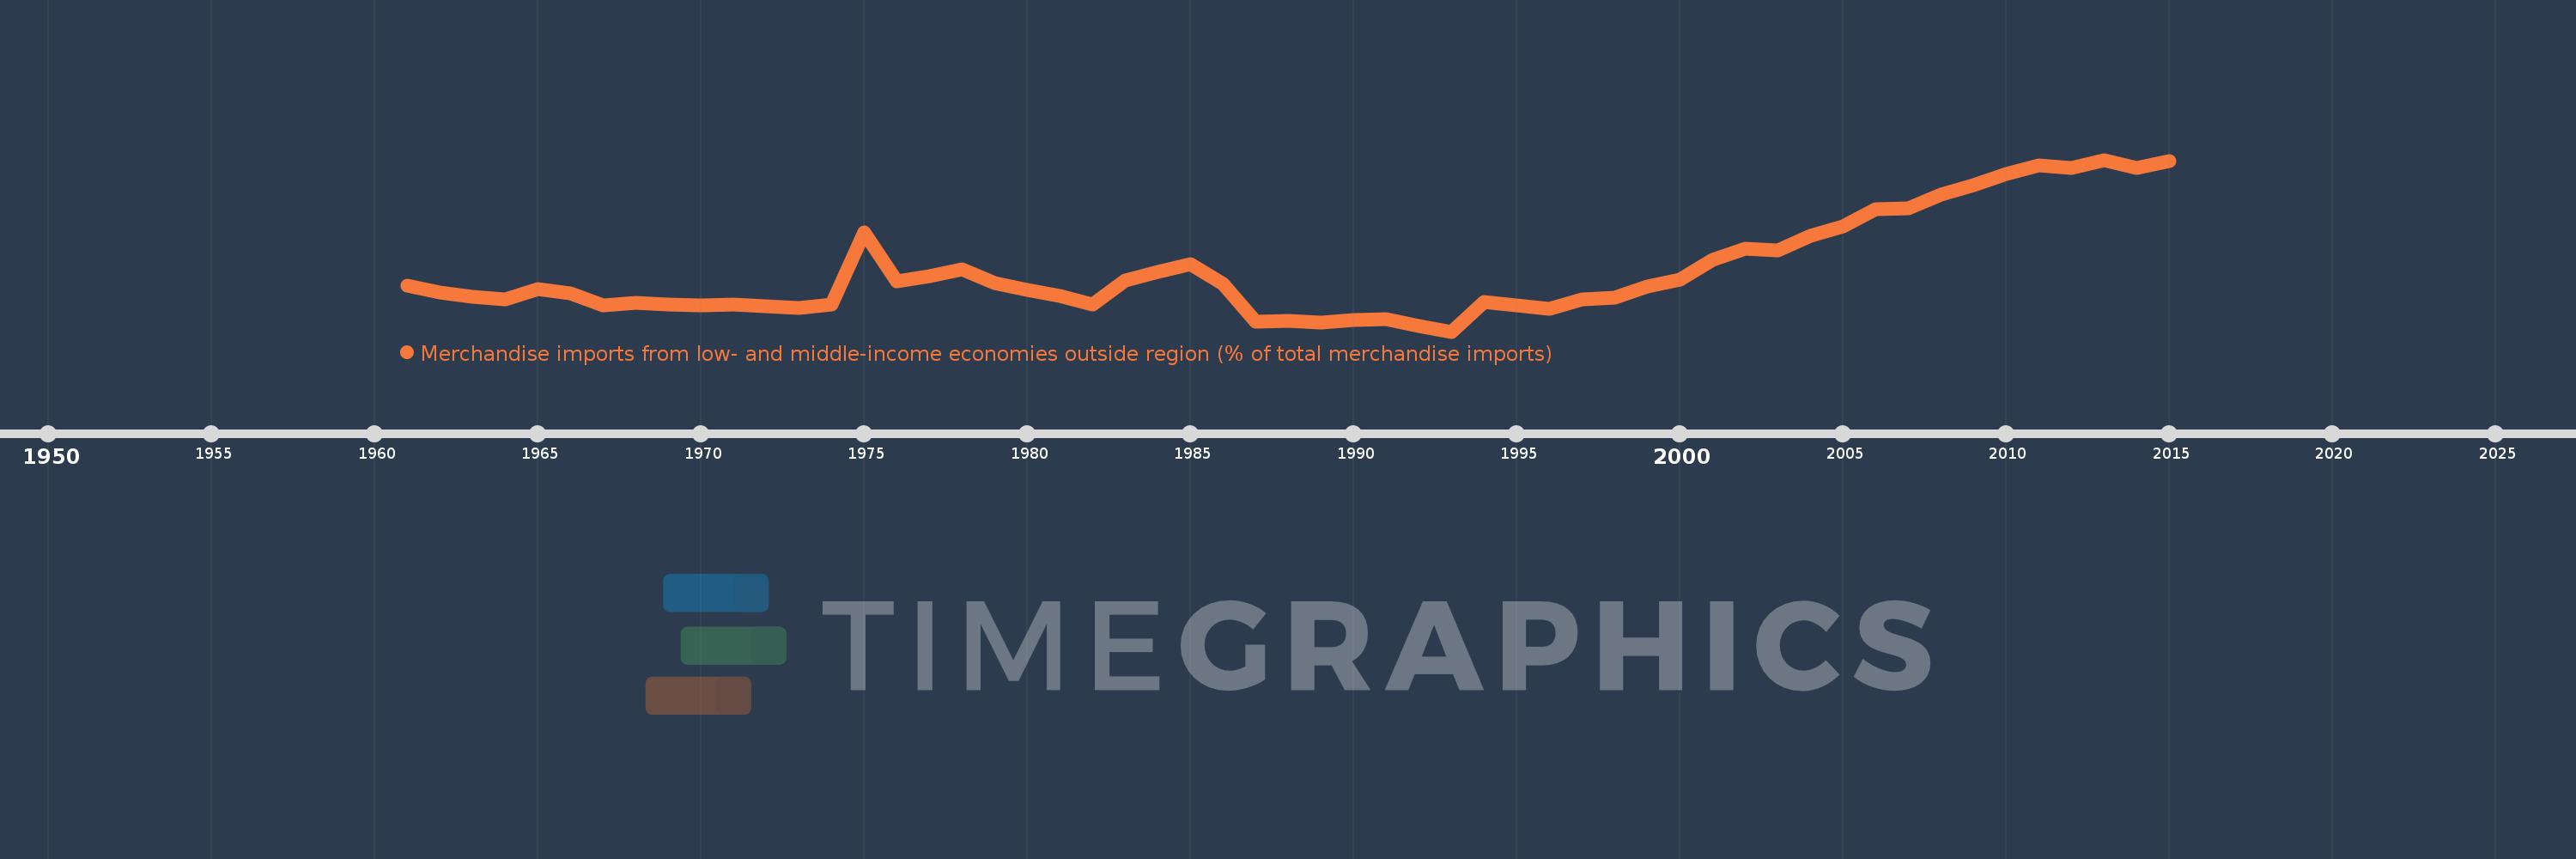
Merchandise imports from low- and middle-income economies outside region (% of total merchandise imports)
2015,2014,2013,2012,2011,2010,2009,2008,2007,2006,2005,2004,2003,2002,2001,2000,1999,1998,1997,1996,1995,1994,1993,1992,1991,1990,1989,1988,1987,1986,1985,1984,1983,1982,1981,1980,1979,1978,1977,1976,1975,1974,1973,1972,1971,1970,1969,1968,1967,1966,1965,1964,1963,1962,1961
Queste statistiche in altri paesi:
AfghanistanAlbaniaAlgeriaAngolaArab WorldArgentinaArmeniaArubaAustraliaAustriaAzerbaijanBahamas, TheBahrainBangladeshBarbadosBelarusBelgiumBelizeBeninBermudaBoliviaBrazilBrunei DarussalamBulgariaBurkina FasoBurundiCabo VerdeCambodiaCameroonCanadaCaribbean small statesCentral African RepublicCentral Europe and the BalticsChileChinaColombiaCongo, Dem. Rep.Congo, Rep.Costa RicaCote d'IvoireCroatiaCubaCyprusCzech RepublicDenmarkDominicaDominican RepublicEarly-demographic dividendEast Asia & PacificEast Asia & Pacific (excluding high income)East Asia & Pacific (IDA & IBRD countries)EcuadorEgypt, Arab Rep.El SalvadorEstoniaEthiopiaEuro areaEurope & Central AsiaEurope & Central Asia (excluding high income)Europe & Central Asia (IDA & IBRD countries)European UnionFijiFinlandFragile and conflict affected situationsFranceGabonGambia, TheGeorgiaGermanyGhanaGreeceGreenlandGrenadaGuatemalaGuineaGuyanaHaitiHeavily indebted poor countries (HIPC)High incomeHondurasHong Kong SAR, ChinaHungaryIBRD onlyIcelandIDA & IBRD totalIDA blendIDA onlyIDA totalIndiaIndonesiaIran, Islamic Rep.IraqIrelandIsraelItalyJamaicaJapanJordanKazakhstanKenyaKorea, Dem. People’s Rep.Korea, Rep.KuwaitKyrgyz RepublicLao PDRLate-demographic dividendLatin America & Caribbean Latin America & Caribbean (excluding high income)Latin America & the Caribbean (IDA & IBRD countries)LatviaLeast developed countries: UN classificationLebanonLiberiaLibyaLithuaniaLow & middle incomeLow incomeLower middle incomeLuxembourgMacao SAR, ChinaMacedonia, FYRMadagascarMalawiMalaysiaMaliMaltaMauritaniaMauritiusMexicoMiddle East & North AfricaMiddle East & North Africa (excluding high income)Middle East & North Africa (IDA & IBRD countries)Middle incomeMoldovaMongoliaMontenegroMoroccoMozambiqueMyanmarNetherlandsNew CaledoniaNew ZealandNicaraguaNigerNigeriaNorth AmericaNorwayOECD membersOmanOther small statesPacific island small statesPakistanPanamaPapua New GuineaParaguayPeruPhilippinesPolandPortugalPost-demographic dividendPre-demographic dividendQatarRomaniaRussian FederationRwandaSaudi ArabiaSenegalSerbiaSeychellesSierra LeoneSingaporeSlovak RepublicSloveniaSmall statesSomaliaSouth AfricaSouth AsiaSouth Asia (IDA & IBRD)SpainSri LankaSt. Kitts and NevisSt. LuciaSt. Vincent and the GrenadinesSub-Saharan Africa Sub-Saharan Africa (excluding high income)Sub-Saharan Africa (IDA & IBRD countries)SudanSurinameSwedenSwitzerlandSyrian Arab RepublicTanzaniaThailandTogoTrinidad and TobagoTunisiaTurkeyUgandaUkraineUnited Arab EmiratesUnited KingdomUnited StatesUpper middle incomeUruguayVenezuela, RBVietnamWorldYemen, Rep.ZambiaZimbabwe Linea del tempo:
Questa scala temporale mostra un grafico dal 1961 anno al 2015 anno. Netherlands. I dati fino ad 1960 anno non disponibili. Il numero di osservazioni attuali secondo i date: 55.
La fonte (nome):
Indicatori dello sviluppo mondiale
La fonte (organizzazione):
World Bank staff estimates based data from International Monetary Fund's Direction of Trade database.
Categorie:
Private Sector, Trade
sono stati aggiornati
23 apr 2017 anni
Indicatori delle variazioni dei valori per anni
Minima:
7.805
1 gen 1993 anni
Massimo:
26.863
1 gen 2013 anni
Alla data di osservazione
Valore
Variazione assoluta
La variazione rispetto al valore precedente
1 gen 1961 anni
12.931
+12.931
0.0%
1 gen 1962 anni
12.176
-0.754
-5.83%
1 gen 1963 anni
11.663
-0.514
-4.22%
1 gen 1964 anni
11.401
-0.261
-2.24%
1 gen 1965 anni
12.498
+1.097
9.62%
1 gen 1966 anni
12.092
-0.406
-3.25%
1 gen 1967 anni
10.749
-1.343
-11.11%
1 gen 1968 anni
10.978
+0.228
2.12%
1 gen 1969 anni
10.825
-0.153
-1.39%
1 gen 1970 anni
10.68
-0.144
-1.33%
1 gen 1971 anni
10.825
+0.145
1.36%
1 gen 1972 anni
10.624
-0.201
-1.86%
1 gen 1973 anni
10.432
-0.192
-1.81%
1 gen 1974 anni
10.807
+0.375
3.59%
1 gen 1975 anni
18.784
+7.978
73.82%
1 gen 1976 anni
13.364
-5.42
-28.85%
1 gen 1977 anni
13.993
+0.629
4.71%
1 gen 1978 anni
14.709
+0.715
5.11%
1 gen 1979 anni
13.145
-1.563
-10.63%
1 gen 1980 anni
12.394
-0.751
-5.71%
1 gen 1981 anni
11.78
-0.615
-4.96%
1 gen 1982 anni
10.844
-0.935
-7.94%
1 gen 1983 anni
13.431
+2.587
23.86%
1 gen 1984 anni
14.384
+0.953
7.09%
1 gen 1985 anni
15.279
+0.895
6.23%
1 gen 1986 anni
13.069
-2.211
-14.47%
1 gen 1987 anni
8.918
-4.15
-31.76%
1 gen 1988 anni
8.976
+0.057
0.64%
1 gen 1989 anni
8.774
-0.202
-2.25%
1 gen 1990 anni
9.073
+0.299
3.41%
1 gen 1991 anni
9.213
+0.14
1.54%
1 gen 1992 anni
8.446
-0.767
-8.32%
1 gen 1993 anni
7.805
-0.642
-7.6%
1 gen 1994 anni
11.137
+3.332
42.7%
1 gen 1995 anni
10.683
-0.454
-4.08%
1 gen 1996 anni
10.337
-0.346
-3.24%
1 gen 1997 anni
11.367
+1.03
9.96%
1 gen 1998 anni
11.563
+0.197
1.73%
1 gen 1999 anni
12.782
+1.218
10.54%
1 gen 2000 anni
13.586
+0.804
6.29%
1 gen 2001 anni
15.766
+2.18
16.05%
1 gen 2002 anni
16.979
+1.213
7.69%
1 gen 2003 anni
16.85
-0.129
-0.76%
1 gen 2004 anni
18.432
+1.583
9.39%
1 gen 2005 anni
19.46
+1.028
5.58%
1 gen 2006 anni
21.363
+1.903
9.78%
1 gen 2007 anni
21.478
+0.116
0.54%
1 gen 2008 anni
23.013
+1.535
7.15%
1 gen 2009 anni
24.014
+1.001
4.35%
1 gen 2010 anni
25.302
+1.288
5.36%
1 gen 2011 anni
26.245
+0.943
3.73%
1 gen 2012 anni
25.998
-0.247
-0.94%
1 gen 2013 anni
26.863
+0.864
3.32%
1 gen 2014 anni
25.975
-0.888
-3.3%
1 gen 2015 anni
26.743
+0.768
2.96%
Classificazione dei paesi secondo i statistiche attuali per anni


Commenti: