29
/it/
it
AIzaSyAYiBZKx7MnpbEhh9jyipgxe19OcubqV5w
April 1, 2024
262553
Thailand
THA
true
2
1
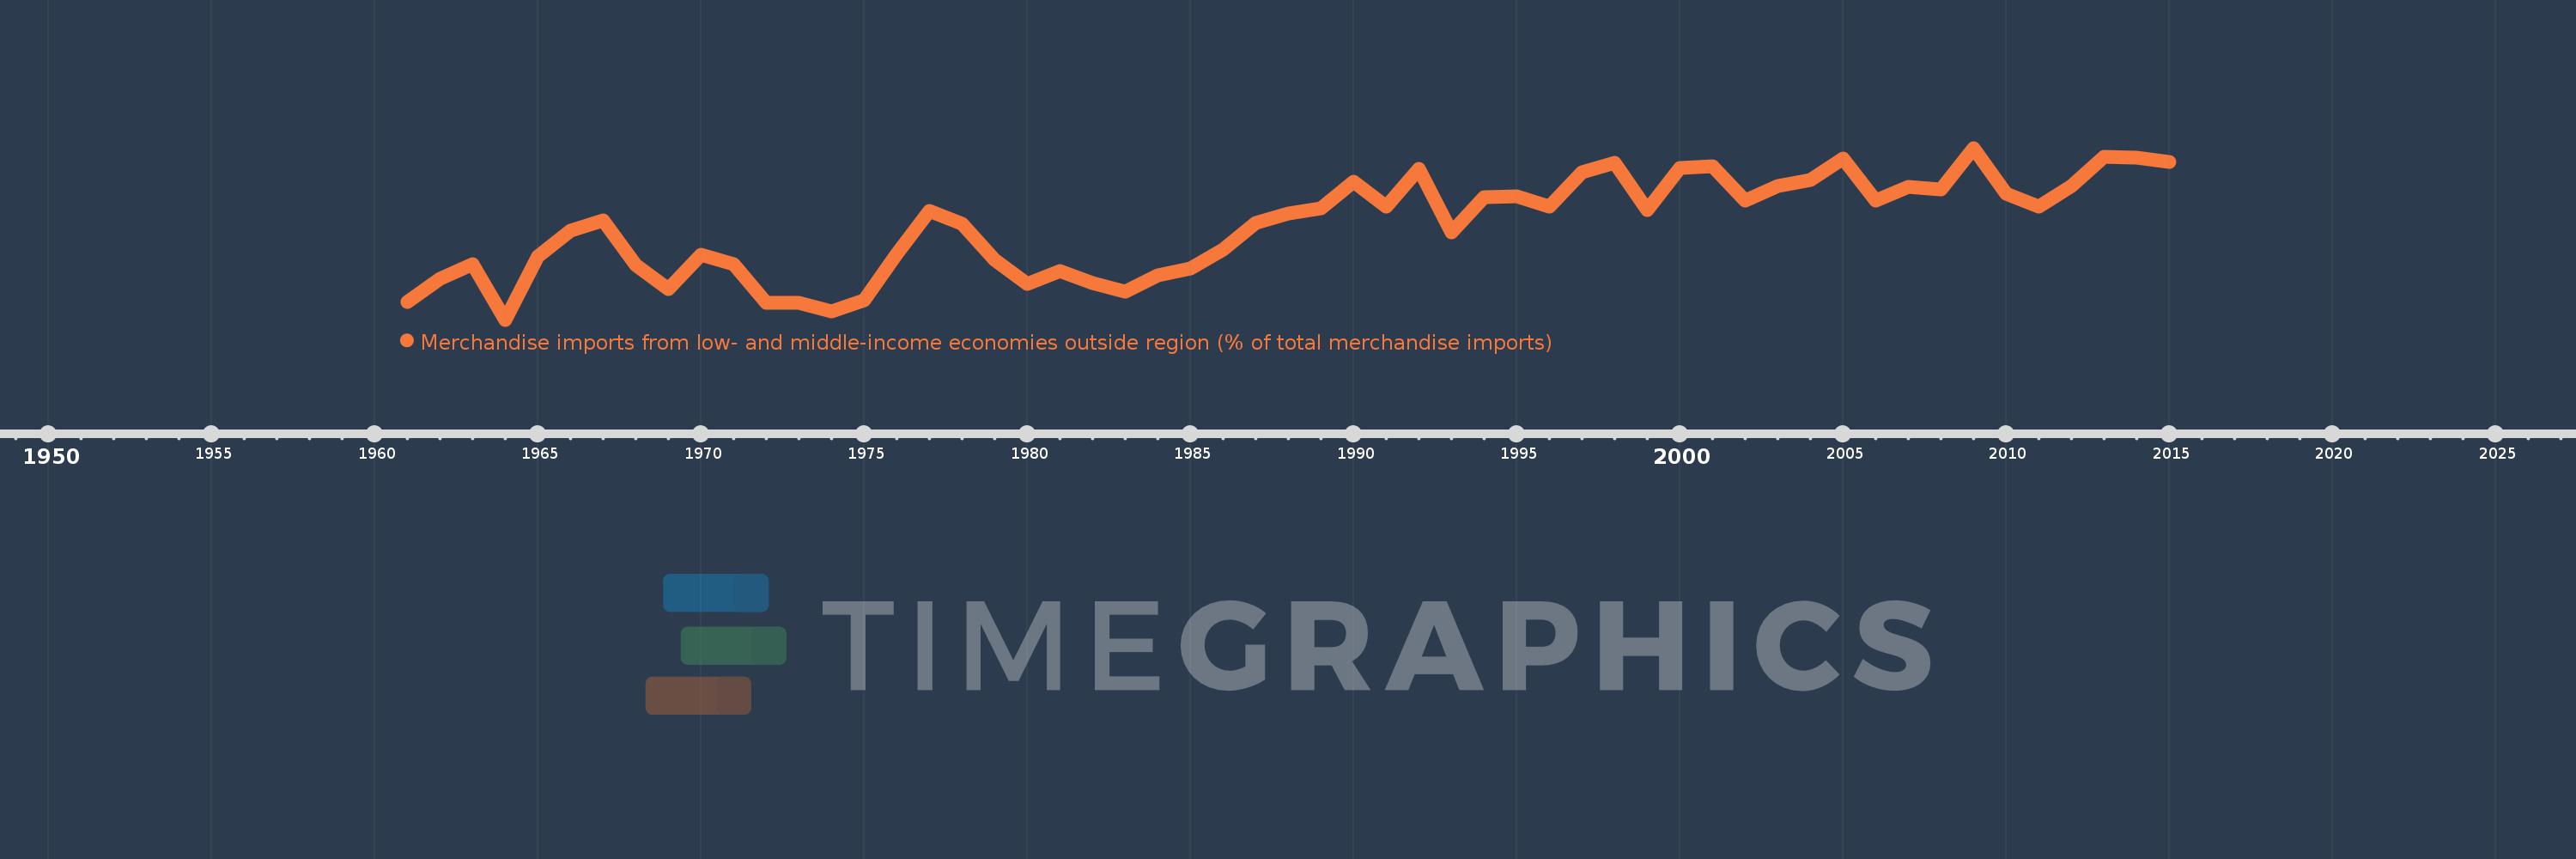
Merchandise imports from low- and middle-income economies outside region (% of total merchandise imports)
2015,2014,2013,2012,2011,2010,2009,2008,2007,2006,2005,2004,2003,2002,2001,2000,1999,1998,1997,1996,1995,1994,1993,1992,1991,1990,1989,1988,1987,1986,1985,1984,1983,1982,1981,1980,1979,1978,1977,1976,1975,1974,1973,1972,1971,1970,1969,1968,1967,1966,1965,1964,1963,1962,1961
Queste statistiche in altri paesi:
AfghanistanAlbaniaAlgeriaAngolaArab WorldArgentinaArmeniaArubaAustraliaAustriaAzerbaijanBahamas, TheBahrainBangladeshBarbadosBelarusBelgiumBelizeBeninBermudaBoliviaBrazilBrunei DarussalamBulgariaBurkina FasoBurundiCabo VerdeCambodiaCameroonCanadaCaribbean small statesCentral African RepublicCentral Europe and the BalticsChileChinaColombiaCongo, Dem. Rep.Congo, Rep.Costa RicaCote d'IvoireCroatiaCubaCyprusCzech RepublicDenmarkDominicaDominican RepublicEarly-demographic dividendEast Asia & PacificEast Asia & Pacific (excluding high income)East Asia & Pacific (IDA & IBRD countries)EcuadorEgypt, Arab Rep.El SalvadorEstoniaEthiopiaEuro areaEurope & Central AsiaEurope & Central Asia (excluding high income)Europe & Central Asia (IDA & IBRD countries)European UnionFijiFinlandFragile and conflict affected situationsFranceGabonGambia, TheGeorgiaGermanyGhanaGreeceGreenlandGrenadaGuatemalaGuineaGuyanaHaitiHeavily indebted poor countries (HIPC)High incomeHondurasHong Kong SAR, ChinaHungaryIBRD onlyIcelandIDA & IBRD totalIDA blendIDA onlyIDA totalIndiaIndonesiaIran, Islamic Rep.IraqIrelandIsraelItalyJamaicaJapanJordanKazakhstanKenyaKorea, Dem. People’s Rep.Korea, Rep.KuwaitKyrgyz RepublicLao PDRLate-demographic dividendLatin America & Caribbean Latin America & Caribbean (excluding high income)Latin America & the Caribbean (IDA & IBRD countries)LatviaLeast developed countries: UN classificationLebanonLiberiaLibyaLithuaniaLow & middle incomeLow incomeLower middle incomeLuxembourgMacao SAR, ChinaMacedonia, FYRMadagascarMalawiMalaysiaMaliMaltaMauritaniaMauritiusMexicoMiddle East & North AfricaMiddle East & North Africa (excluding high income)Middle East & North Africa (IDA & IBRD countries)Middle incomeMoldovaMongoliaMontenegroMoroccoMozambiqueMyanmarNetherlandsNew CaledoniaNew ZealandNicaraguaNigerNigeriaNorth AmericaNorwayOECD membersOmanOther small statesPacific island small statesPakistanPanamaPapua New GuineaParaguayPeruPhilippinesPolandPortugalPost-demographic dividendPre-demographic dividendQatarRomaniaRussian FederationRwandaSaudi ArabiaSenegalSerbiaSeychellesSierra LeoneSingaporeSlovak RepublicSloveniaSmall statesSomaliaSouth AfricaSouth AsiaSouth Asia (IDA & IBRD)SpainSri LankaSt. Kitts and NevisSt. LuciaSt. Vincent and the GrenadinesSub-Saharan Africa Sub-Saharan Africa (excluding high income)Sub-Saharan Africa (IDA & IBRD countries)SudanSurinameSwedenSwitzerlandSyrian Arab RepublicTanzaniaThailandTogoTrinidad and TobagoTunisiaTurkeyUgandaUkraineUnited Arab EmiratesUnited KingdomUnited StatesUpper middle incomeUruguayVenezuela, RBVietnamWorldYemen, Rep.ZambiaZimbabwe Linea del tempo:
Questa scala temporale mostra un grafico dal 1961 anno al 2015 anno. Thailand. I dati fino ad 1960 anno non disponibili. Il numero di osservazioni attuali secondo i date: 55.
La fonte (nome):
Indicatori dello sviluppo mondiale
La fonte (organizzazione):
World Bank staff estimates based data from International Monetary Fund's Direction of Trade database.
Categorie:
Private Sector, Trade
sono stati aggiornati
23 apr 2017 anni
Indicatori delle variazioni dei valori per anni
Minima:
2.147
1 gen 1964 anni
Massimo:
6.523
1 gen 2009 anni
Alla data di osservazione
Valore
Variazione assoluta
La variazione rispetto al valore precedente
1 gen 1961 anni
2.604
+2.604
0.0%
1 gen 1962 anni
3.181
+0.577
22.17%
1 gen 1963 anni
3.555
+0.374
11.75%
1 gen 1964 anni
2.147
-1.407
-39.59%
1 gen 1965 anni
3.768
+1.621
75.47%
1 gen 1966 anni
4.416
+0.648
17.18%
1 gen 1967 anni
4.689
+0.273
6.19%
1 gen 1968 anni
3.551
-1.139
-24.28%
1 gen 1969 anni
2.924
-0.627
-17.66%
1 gen 1970 anni
3.795
+0.871
29.79%
1 gen 1971 anni
3.558
-0.237
-6.24%
1 gen 1972 anni
2.587
-0.971
-27.29%
1 gen 1973 anni
2.573
-0.014
-0.54%
1 gen 1974 anni
2.367
-0.206
-8.01%
1 gen 1975 anni
2.637
+0.271
11.43%
1 gen 1976 anni
3.836
+1.199
45.44%
1 gen 1977 anni
4.923
+1.087
28.34%
1 gen 1978 anni
4.581
-0.342
-6.95%
1 gen 1979 anni
3.666
-0.915
-19.98%
1 gen 1980 anni
3.062
-0.604
-16.48%
1 gen 1981 anni
3.387
+0.325
10.62%
1 gen 1982 anni
3.073
-0.314
-9.28%
1 gen 1983 anni
2.855
-0.217
-7.07%
1 gen 1984 anni
3.287
+0.431
15.1%
1 gen 1985 anni
3.449
+0.163
4.95%
1 gen 1986 anni
3.936
+0.487
14.13%
1 gen 1987 anni
4.605
+0.669
16.98%
1 gen 1988 anni
4.861
+0.256
5.55%
1 gen 1989 anni
4.991
+0.13
2.68%
1 gen 1990 anni
5.665
+0.673
13.49%
1 gen 1991 anni
5.022
-0.642
-11.34%
1 gen 1992 anni
5.995
+0.973
19.37%
1 gen 1993 anni
4.381
-1.613
-26.91%
1 gen 1994 anni
5.262
+0.881
20.11%
1 gen 1995 anni
5.296
+0.034
0.64%
1 gen 1996 anni
5.018
-0.279
-5.26%
1 gen 1997 anni
5.905
+0.888
17.69%
1 gen 1998 anni
6.152
+0.246
4.17%
1 gen 1999 anni
4.95
-1.202
-19.54%
1 gen 2000 anni
6.023
+1.073
21.68%
1 gen 2001 anni
6.062
+0.039
0.65%
1 gen 2002 anni
5.189
-0.873
-14.4%
1 gen 2003 anni
5.558
+0.369
7.11%
1 gen 2004 anni
5.709
+0.15
2.7%
1 gen 2005 anni
6.255
+0.546
9.57%
1 gen 2006 anni
5.171
-1.084
-17.33%
1 gen 2007 anni
5.527
+0.356
6.88%
1 gen 2008 anni
5.475
-0.051
-0.93%
1 gen 2009 anni
6.523
+1.047
19.13%
1 gen 2010 anni
5.347
-1.176
-18.03%
1 gen 2011 anni
5.02
-0.327
-6.12%
1 gen 2012 anni
5.557
+0.537
10.71%
1 gen 2013 anni
6.297
+0.74
13.31%
1 gen 2014 anni
6.267
-0.03
-0.47%
1 gen 2015 anni
6.167
-0.101
-1.61%
Classificazione dei paesi secondo i statistiche attuali per anni


Commenti: