29
/it/
it
AIzaSyAYiBZKx7MnpbEhh9jyipgxe19OcubqV5w
April 1, 2024
268384
Tunisia
TUN
true
2
1
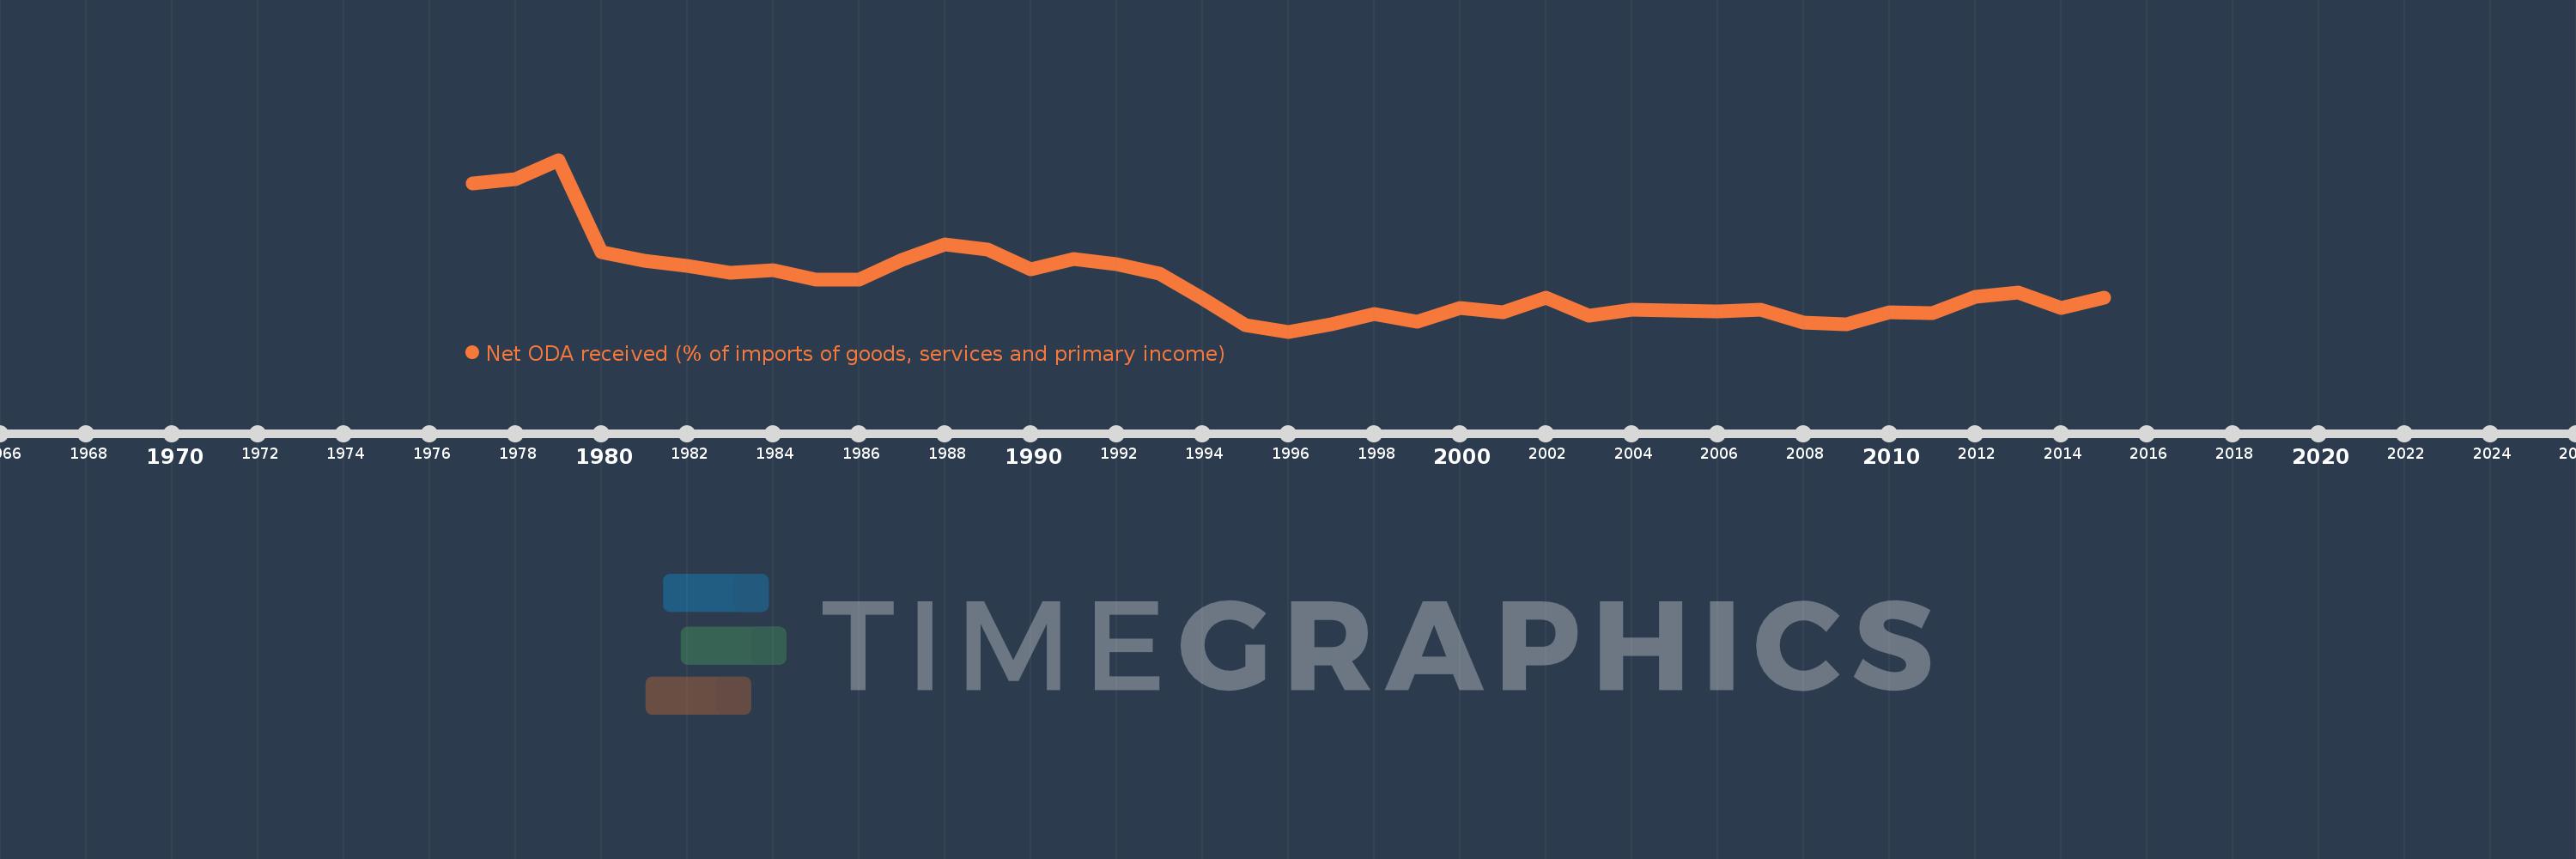
Net ODA received (% of imports of goods, services and primary income)
2015,2014,2013,2012,2011,2010,2009,2008,2007,2006,2005,2004,2003,2002,2001,2000,1999,1998,1997,1996,1995,1994,1993,1992,1991,1990,1989,1988,1987,1986,1985,1984,1983,1982,1981,1980,1979,1978,1977
Queste statistiche in altri paesi:
AfghanistanAlbaniaAlgeriaAngolaAntigua and BarbudaArab WorldArgentinaArmeniaArubaAzerbaijanBahamas, TheBahrainBangladeshBarbadosBelarusBelizeBeninBhutanBoliviaBosnia and HerzegovinaBotswanaBrazilBurkina FasoBurundiCabo VerdeCambodiaCameroonCaribbean small statesCentral African RepublicCentral Europe and the BalticsChadChileChinaColombiaComorosCongo, Dem. Rep.Congo, Rep.Costa RicaCote d'IvoireCroatiaCyprusDjiboutiDominicaDominican RepublicEast Asia & PacificEast Asia & Pacific (excluding high income)East Asia & Pacific (IDA & IBRD countries)EcuadorEgypt, Arab Rep.El SalvadorEquatorial GuineaEritreaEthiopiaEuro areaEurope & Central AsiaEurope & Central Asia (excluding high income)Europe & Central Asia (IDA & IBRD countries)European UnionFijiFragile and conflict affected situationsGabonGambia, TheGeorgiaGhanaGrenadaGuatemalaGuineaGuinea-BissauGuyanaHaitiHeavily indebted poor countries (HIPC)High incomeHondurasIBRD onlyIDA & IBRD totalIDA blendIDA onlyIDA totalIndiaIndonesiaIran, Islamic Rep.IraqIsraelJamaicaJordanKazakhstanKenyaKiribatiKorea, Rep.KosovoKuwaitKyrgyz RepublicLao PDRLatin America & Caribbean Latin America & Caribbean (excluding high income)Latin America & the Caribbean (IDA & IBRD countries)Least developed countries: UN classificationLebanonLesothoLiberiaLibyaLow & middle incomeLow incomeLower middle incomeMacedonia, FYRMadagascarMalawiMalaysiaMaldivesMaliMaltaMarshall IslandsMauritaniaMauritiusMexicoMicronesia, Fed. Sts.Middle East & North Africa (excluding high income)Middle East & North Africa (IDA & IBRD countries)Middle incomeMoldovaMongoliaMontenegroMoroccoMozambiqueMyanmarNamibiaNepalNicaraguaNigerNigeriaNorth AmericaOECD membersOmanOther small statesPacific island small statesPakistanPalauPanamaPapua New GuineaParaguayPeruPhilippinesRwandaSamoaSao Tome and PrincipeSaudi ArabiaSenegalSerbiaSeychellesSierra LeoneSingaporeSloveniaSmall statesSolomon IslandsSouth AfricaSouth AsiaSouth Asia (IDA & IBRD)South SudanSri LankaSt. Kitts and NevisSt. LuciaSt. Vincent and the GrenadinesSub-Saharan Africa Sub-Saharan Africa (excluding high income)Sub-Saharan Africa (IDA & IBRD countries)SudanSurinameSwazilandSyrian Arab RepublicTajikistanTanzaniaThailandTimor-LesteTogoTongaTrinidad and TobagoTunisiaTurkeyTuvaluUgandaUkraineUpper middle incomeUruguayVanuatuVenezuela, RBVietnamWest Bank and GazaWorldYemen, Rep.ZambiaZimbabwe Linea del tempo:
Questa scala temporale mostra un grafico dal 1977 anno al 2015 anno. Tunisia. I dati fino ad 1976 anno non disponibili. Il numero di osservazioni attuali secondo i date: 39.
La fonte (nome):
Indicatori dello sviluppo mondiale
La fonte (organizzazione):
Development Assistance Committee of the Organisation for Economic Co-operation and Development, Geographical Distribution of Financial Flows to Developing Countries, Development Co-operation Report, and International Development Statistics database. Data are available online at: www.oecd.org/dac/stats/idsonline. World Bank imports of good and services estimates are used for the denominator.
Categorie:
Aid Effectiveness
sono stati aggiornati
23 apr 2017 anni
Indicatori delle variazioni dei valori per anni
Minima:
0.771
1 gen 1996 anni
Massimo:
13.026
1 gen 1979 anni
Alla data di osservazione
Valore
Variazione assoluta
La variazione rispetto al valore precedente
1 gen 1977 anni
11.337
+11.337
0.0%
1 gen 1978 anni
11.634
+0.297
2.62%
1 gen 1979 anni
13.026
+1.392
11.97%
1 gen 1980 anni
6.467
-6.56
-50.36%
1 gen 1981 anni
5.838
-0.628
-9.72%
1 gen 1982 anni
5.479
-0.36
-6.16%
1 gen 1983 anni
4.962
-0.516
-9.42%
1 gen 1984 anni
5.174
+0.212
4.27%
1 gen 1985 anni
4.501
-0.672
-13.0%
1 gen 1986 anni
4.449
-0.053
-1.17%
1 gen 1987 anni
5.871
+1.422
31.96%
1 gen 1988 anni
6.961
+1.09
18.56%
1 gen 1989 anni
6.616
-0.345
-4.95%
1 gen 1990 anni
5.21
-1.406
-21.25%
1 gen 1991 anni
5.956
+0.746
14.32%
1 gen 1992 anni
5.586
-0.37
-6.21%
1 gen 1993 anni
4.923
-0.664
-11.88%
1 gen 1994 anni
3.12
-1.803
-36.62%
1 gen 1995 anni
1.26
-1.86
-59.62%
1 gen 1996 anni
0.771
-0.489
-38.79%
1 gen 1997 anni
1.317
+0.546
70.81%
1 gen 1998 anni
2.015
+0.698
52.98%
1 gen 1999 anni
1.496
-0.52
-25.78%
1 gen 2000 anni
2.481
+0.985
65.86%
1 gen 2001 anni
2.153
-0.328
-13.22%
1 gen 2002 anni
3.207
+1.054
48.97%
1 gen 2003 anni
1.934
-1.273
-39.7%
1 gen 2004 anni
2.303
+0.369
19.08%
1 gen 2005 anni
2.259
-0.044
-1.92%
1 gen 2006 anni
2.197
-0.062
-2.73%
1 gen 2007 anni
2.355
+0.158
7.17%
1 gen 2008 anni
1.393
-0.962
-40.85%
1 gen 2009 anni
1.283
-0.11
-7.91%
1 gen 2010 anni
2.156
+0.874
68.12%
1 gen 2011 anni
2.07
-0.087
-4.02%
1 gen 2012 anni
3.266
+1.196
57.79%
1 gen 2013 anni
3.572
+0.306
9.37%
1 gen 2014 anni
2.48
-1.091
-30.56%
1 gen 2015 anni
3.203
+0.723
29.15%
Classificazione dei paesi secondo i statistiche attuali per anni


Commenti: