29
/it/
it
AIzaSyAYiBZKx7MnpbEhh9jyipgxe19OcubqV5w
April 1, 2024
201973
Morocco
MAR
true
2
1
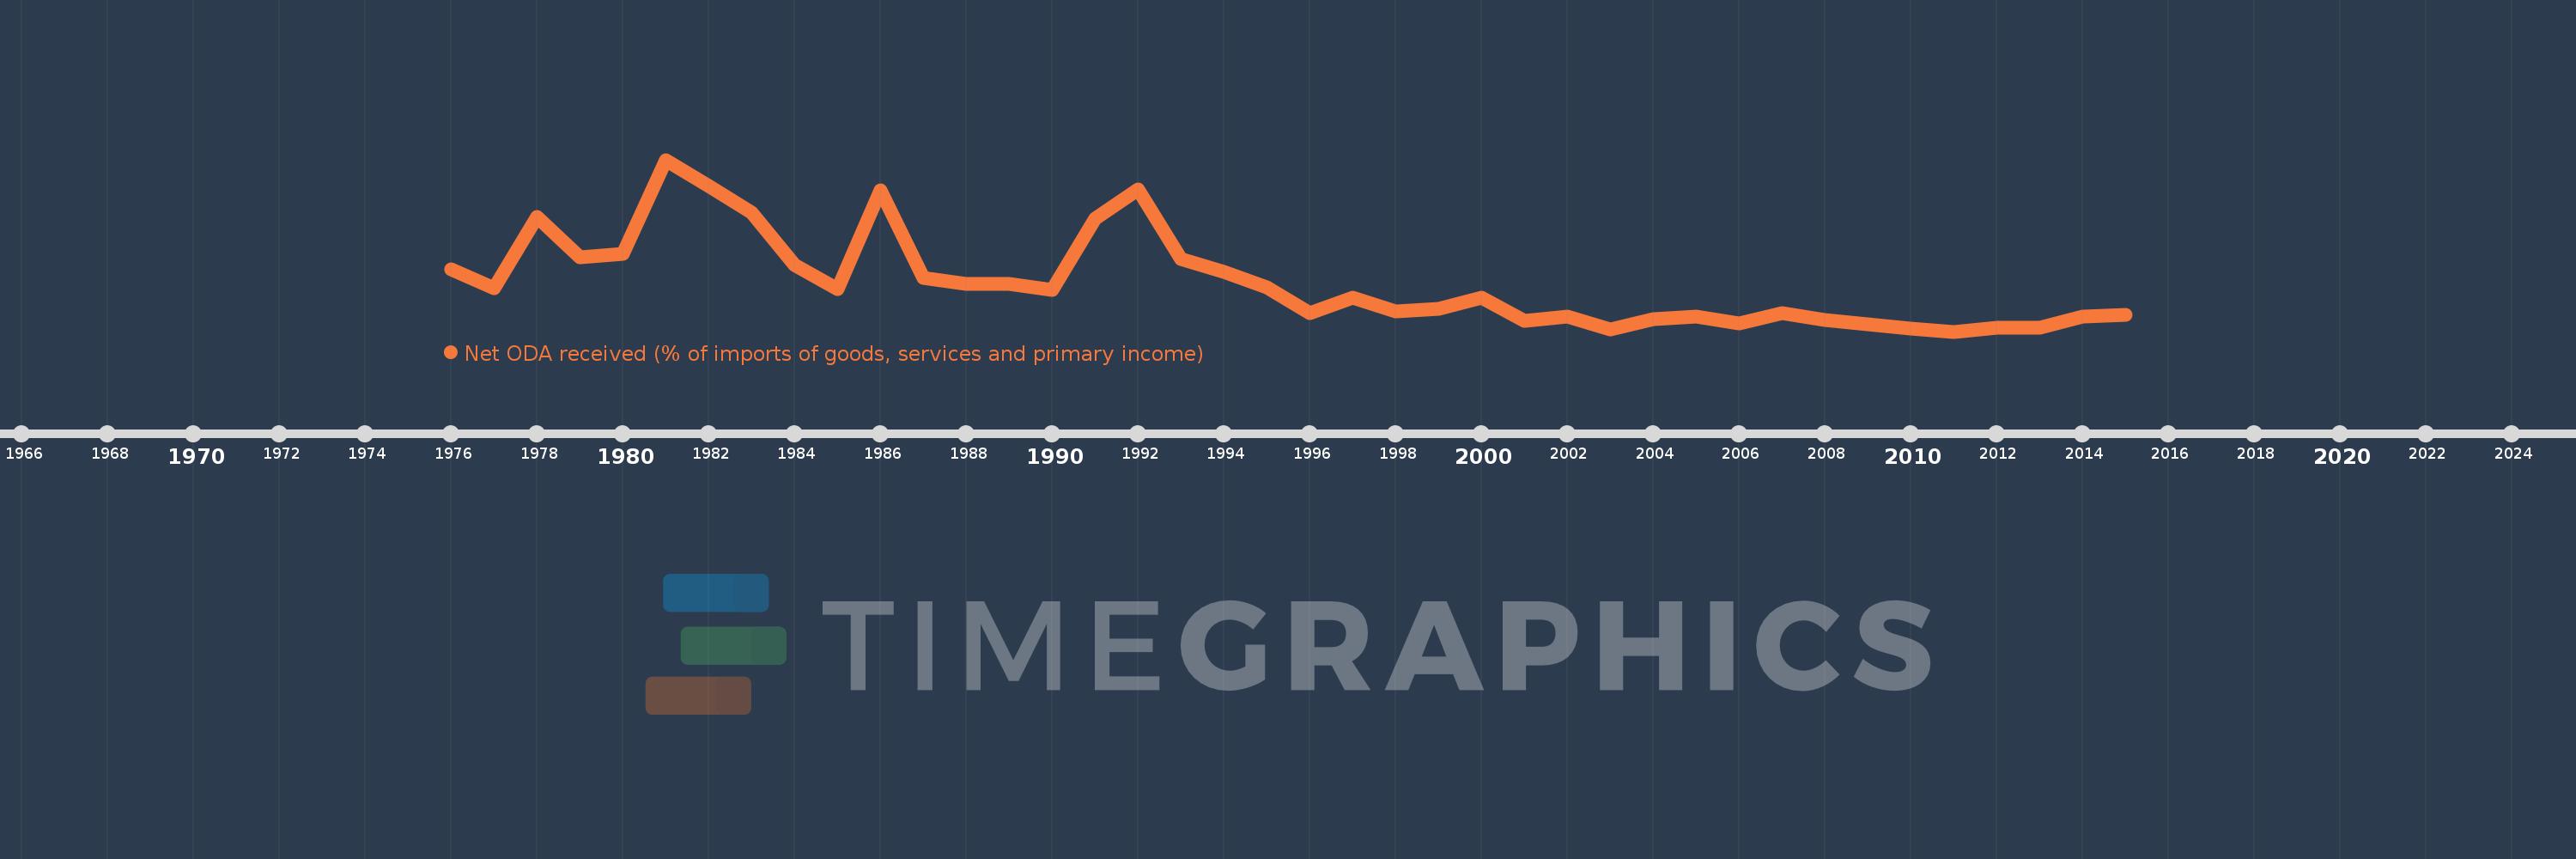
Net ODA received (% of imports of goods, services and primary income)
2015,2014,2013,2012,2011,2010,2009,2008,2007,2006,2005,2004,2003,2002,2001,2000,1999,1998,1997,1996,1995,1994,1993,1992,1991,1990,1989,1988,1987,1986,1985,1984,1983,1982,1981,1980,1979,1978,1977,1976
Queste statistiche in altri paesi:
AfghanistanAlbaniaAlgeriaAngolaAntigua and BarbudaArab WorldArgentinaArmeniaArubaAzerbaijanBahamas, TheBahrainBangladeshBarbadosBelarusBelizeBeninBhutanBoliviaBosnia and HerzegovinaBotswanaBrazilBurkina FasoBurundiCabo VerdeCambodiaCameroonCaribbean small statesCentral African RepublicCentral Europe and the BalticsChadChileChinaColombiaComorosCongo, Dem. Rep.Congo, Rep.Costa RicaCote d'IvoireCroatiaCyprusDjiboutiDominicaDominican RepublicEast Asia & PacificEast Asia & Pacific (excluding high income)East Asia & Pacific (IDA & IBRD countries)EcuadorEgypt, Arab Rep.El SalvadorEquatorial GuineaEritreaEthiopiaEuro areaEurope & Central AsiaEurope & Central Asia (excluding high income)Europe & Central Asia (IDA & IBRD countries)European UnionFijiFragile and conflict affected situationsGabonGambia, TheGeorgiaGhanaGrenadaGuatemalaGuineaGuinea-BissauGuyanaHaitiHeavily indebted poor countries (HIPC)High incomeHondurasIBRD onlyIDA & IBRD totalIDA blendIDA onlyIDA totalIndiaIndonesiaIran, Islamic Rep.IraqIsraelJamaicaJordanKazakhstanKenyaKiribatiKorea, Rep.KosovoKuwaitKyrgyz RepublicLao PDRLatin America & Caribbean Latin America & Caribbean (excluding high income)Latin America & the Caribbean (IDA & IBRD countries)Least developed countries: UN classificationLebanonLesothoLiberiaLibyaLow & middle incomeLow incomeLower middle incomeMacedonia, FYRMadagascarMalawiMalaysiaMaldivesMaliMaltaMarshall IslandsMauritaniaMauritiusMexicoMicronesia, Fed. Sts.Middle East & North Africa (excluding high income)Middle East & North Africa (IDA & IBRD countries)Middle incomeMoldovaMongoliaMontenegroMoroccoMozambiqueMyanmarNamibiaNepalNicaraguaNigerNigeriaNorth AmericaOECD membersOmanOther small statesPacific island small statesPakistanPalauPanamaPapua New GuineaParaguayPeruPhilippinesRwandaSamoaSao Tome and PrincipeSaudi ArabiaSenegalSerbiaSeychellesSierra LeoneSingaporeSloveniaSmall statesSolomon IslandsSouth AfricaSouth AsiaSouth Asia (IDA & IBRD)South SudanSri LankaSt. Kitts and NevisSt. LuciaSt. Vincent and the GrenadinesSub-Saharan Africa Sub-Saharan Africa (excluding high income)Sub-Saharan Africa (IDA & IBRD countries)SudanSurinameSwazilandSyrian Arab RepublicTajikistanTanzaniaThailandTimor-LesteTogoTongaTrinidad and TobagoTunisiaTurkeyTuvaluUgandaUkraineUpper middle incomeUruguayVanuatuVenezuela, RBVietnamWest Bank and GazaWorldYemen, Rep.ZambiaZimbabwe Linea del tempo:
Questa scala temporale mostra un grafico dal 1976 anno al 2015 anno. Morocco. I dati fino ad 1975 anno non disponibili. Il numero di osservazioni attuali secondo i date: 40.
La fonte (nome):
Indicatori dello sviluppo mondiale
La fonte (organizzazione):
Development Assistance Committee of the Organisation for Economic Co-operation and Development, Geographical Distribution of Financial Flows to Developing Countries, Development Co-operation Report, and International Development Statistics database. Data are available online at: www.oecd.org/dac/stats/idsonline. World Bank imports of good and services estimates are used for the denominator.
Categorie:
Aid Effectiveness
sono stati aggiornati
23 apr 2017 anni
Indicatori delle variazioni dei valori per anni
Minima:
2.531
1 gen 2011 anni
Massimo:
19.99
1 gen 1981 anni
Alla data di osservazione
Valore
Variazione assoluta
La variazione rispetto al valore precedente
1 gen 1976 anni
8.839
+8.839
0.0%
1 gen 1977 anni
6.983
-1.856
-21.0%
1 gen 1978 anni
14.202
+7.219
103.38%
1 gen 1979 anni
10.099
-4.104
-28.89%
1 gen 1980 anni
10.406
+0.307
3.04%
1 gen 1981 anni
19.99
+9.584
92.1%
1 gen 1982 anni
17.361
-2.629
-13.15%
1 gen 1983 anni
14.603
-2.758
-15.89%
1 gen 1984 anni
9.291
-5.312
-36.38%
1 gen 1985 anni
6.874
-2.417
-26.02%
1 gen 1986 anni
16.894
+10.021
145.78%
1 gen 1987 anni
8.01
-8.884
-52.59%
1 gen 1988 anni
7.357
-0.653
-8.15%
1 gen 1989 anni
7.384
+0.027
0.36%
1 gen 1990 anni
6.724
-0.66
-8.93%
1 gen 1991 anni
14.019
+7.295
108.49%
1 gen 1992 anni
17.021
+3.002
21.41%
1 gen 1993 anni
9.897
-7.123
-41.85%
1 gen 1994 anni
8.565
-1.332
-13.46%
1 gen 1995 anni
7.065
-1.5
-17.51%
1 gen 1996 anni
4.417
-2.648
-37.49%
1 gen 1997 anni
5.955
+1.538
34.83%
1 gen 1998 anni
4.565
-1.39
-23.34%
1 gen 1999 anni
4.845
+0.28
6.13%
1 gen 2000 anni
6.001
+1.156
23.85%
1 gen 2001 anni
3.595
-2.406
-40.1%
1 gen 2002 anni
4.076
+0.481
13.39%
1 gen 2003 anni
2.765
-1.311
-32.17%
1 gen 2004 anni
3.762
+0.997
36.07%
1 gen 2005 anni
4.074
+0.312
8.29%
1 gen 2006 anni
3.388
-0.686
-16.84%
1 gen 2007 anni
4.394
+1.006
29.7%
1 gen 2008 anni
3.731
-0.663
-15.1%
1 gen 2009 anni
3.231
-0.5
-13.39%
1 gen 2010 anni
2.804
-0.427
-13.22%
1 gen 2011 anni
2.531
-0.273
-9.72%
1 gen 2012 anni
2.942
+0.411
16.23%
1 gen 2013 anni
2.936
-0.006
-0.21%
1 gen 2014 anni
4.035
+1.099
37.43%
1 gen 2015 anni
4.263
+0.228
5.66%
Classificazione dei paesi secondo i statistiche attuali per anni


Commenti: