29
/it/
it
AIzaSyAYiBZKx7MnpbEhh9jyipgxe19OcubqV5w
April 1, 2024
162950
Jamaica
JAM
true
2
1
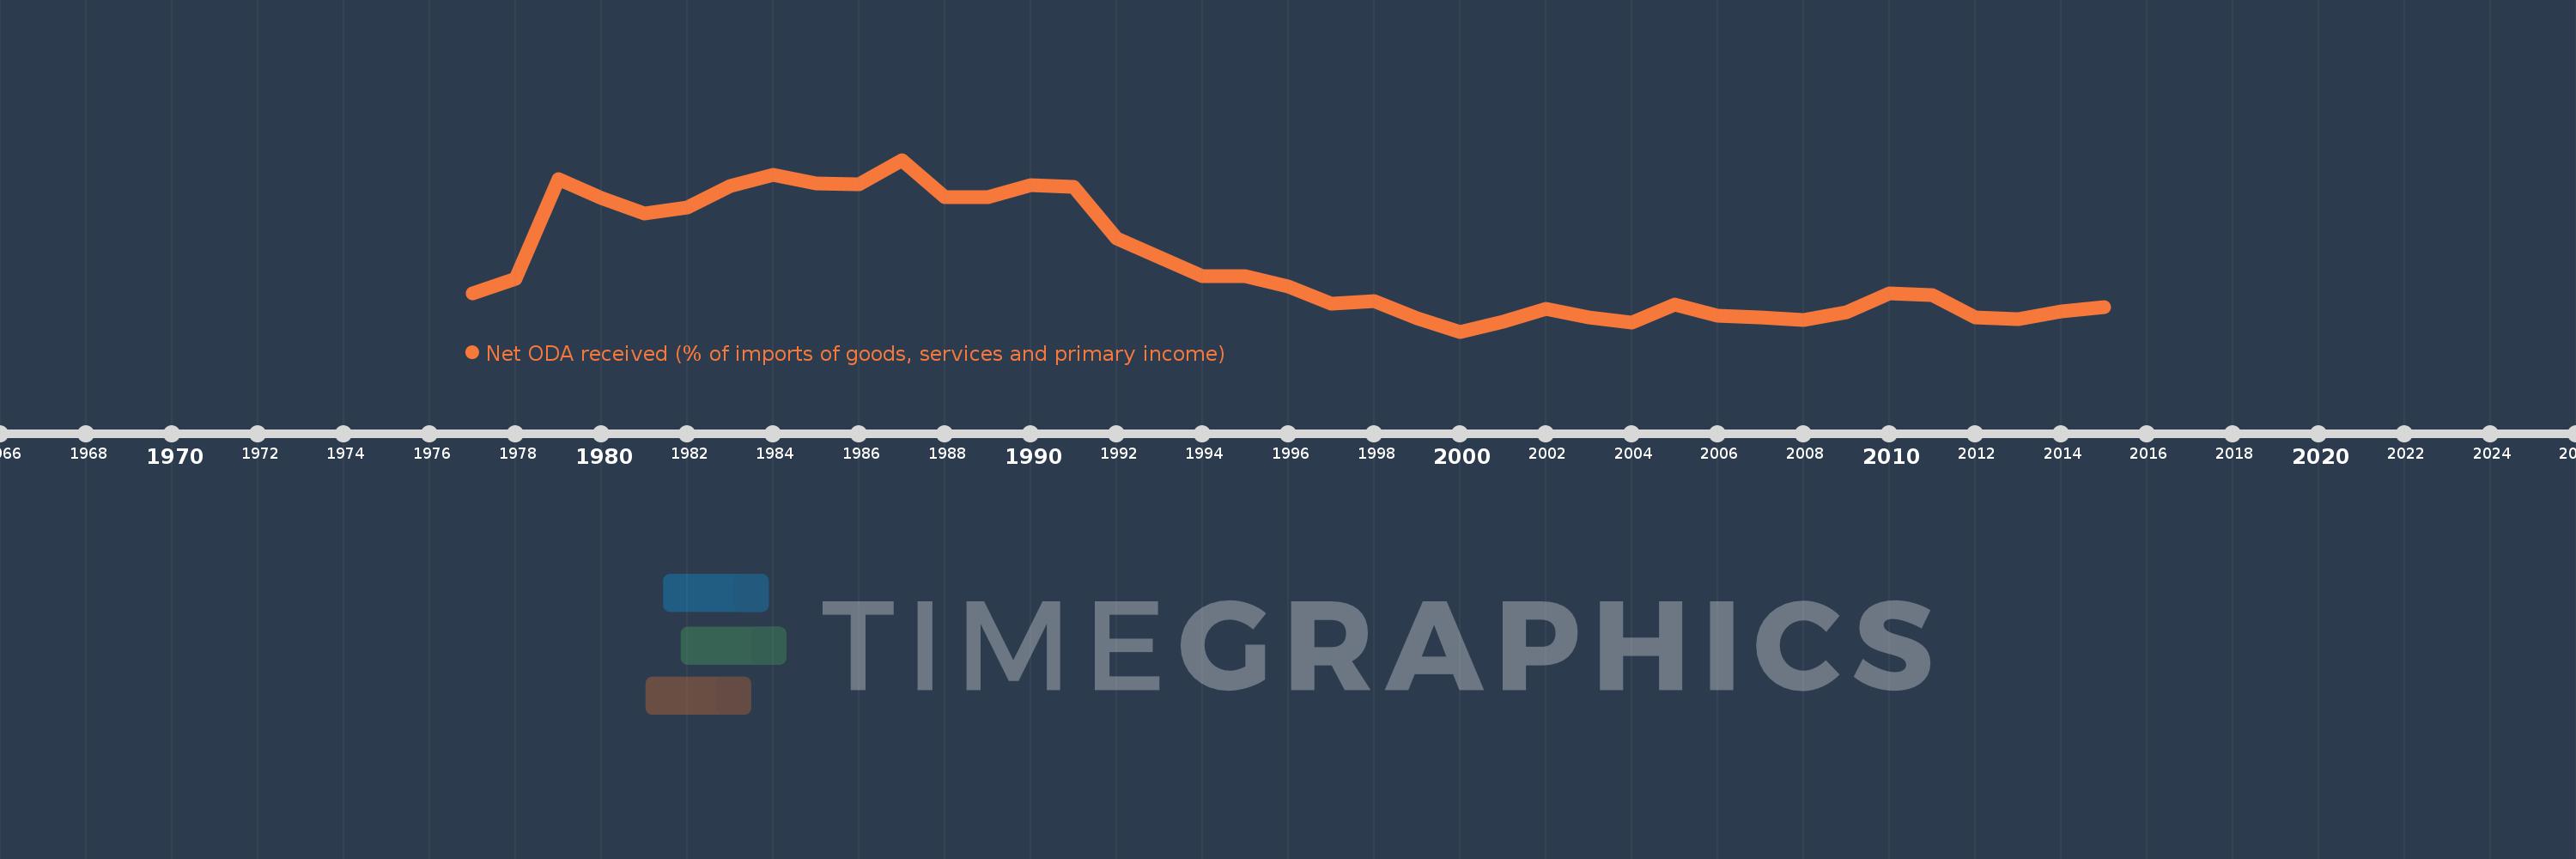
Net ODA received (% of imports of goods, services and primary income)
2015,2014,2013,2012,2011,2010,2009,2008,2007,2006,2005,2004,2003,2002,2001,2000,1999,1998,1997,1996,1995,1994,1993,1992,1991,1990,1989,1988,1987,1986,1985,1984,1983,1982,1981,1980,1979,1978,1977
Queste statistiche in altri paesi:
AfghanistanAlbaniaAlgeriaAngolaAntigua and BarbudaArab WorldArgentinaArmeniaArubaAzerbaijanBahamas, TheBahrainBangladeshBarbadosBelarusBelizeBeninBhutanBoliviaBosnia and HerzegovinaBotswanaBrazilBurkina FasoBurundiCabo VerdeCambodiaCameroonCaribbean small statesCentral African RepublicCentral Europe and the BalticsChadChileChinaColombiaComorosCongo, Dem. Rep.Congo, Rep.Costa RicaCote d'IvoireCroatiaCyprusDjiboutiDominicaDominican RepublicEast Asia & PacificEast Asia & Pacific (excluding high income)East Asia & Pacific (IDA & IBRD countries)EcuadorEgypt, Arab Rep.El SalvadorEquatorial GuineaEritreaEthiopiaEuro areaEurope & Central AsiaEurope & Central Asia (excluding high income)Europe & Central Asia (IDA & IBRD countries)European UnionFijiFragile and conflict affected situationsGabonGambia, TheGeorgiaGhanaGrenadaGuatemalaGuineaGuinea-BissauGuyanaHaitiHeavily indebted poor countries (HIPC)High incomeHondurasIBRD onlyIDA & IBRD totalIDA blendIDA onlyIDA totalIndiaIndonesiaIran, Islamic Rep.IraqIsraelJamaicaJordanKazakhstanKenyaKiribatiKorea, Rep.KosovoKuwaitKyrgyz RepublicLao PDRLatin America & Caribbean Latin America & Caribbean (excluding high income)Latin America & the Caribbean (IDA & IBRD countries)Least developed countries: UN classificationLebanonLesothoLiberiaLibyaLow & middle incomeLow incomeLower middle incomeMacedonia, FYRMadagascarMalawiMalaysiaMaldivesMaliMaltaMarshall IslandsMauritaniaMauritiusMexicoMicronesia, Fed. Sts.Middle East & North Africa (excluding high income)Middle East & North Africa (IDA & IBRD countries)Middle incomeMoldovaMongoliaMontenegroMoroccoMozambiqueMyanmarNamibiaNepalNicaraguaNigerNigeriaNorth AmericaOECD membersOmanOther small statesPacific island small statesPakistanPalauPanamaPapua New GuineaParaguayPeruPhilippinesRwandaSamoaSao Tome and PrincipeSaudi ArabiaSenegalSerbiaSeychellesSierra LeoneSingaporeSloveniaSmall statesSolomon IslandsSouth AfricaSouth AsiaSouth Asia (IDA & IBRD)South SudanSri LankaSt. Kitts and NevisSt. LuciaSt. Vincent and the GrenadinesSub-Saharan Africa Sub-Saharan Africa (excluding high income)Sub-Saharan Africa (IDA & IBRD countries)SudanSurinameSwazilandSyrian Arab RepublicTajikistanTanzaniaThailandTimor-LesteTogoTongaTrinidad and TobagoTunisiaTurkeyTuvaluUgandaUkraineUpper middle incomeUruguayVanuatuVenezuela, RBVietnamWest Bank and GazaWorldYemen, Rep.ZambiaZimbabwe Linea del tempo:
Questa scala temporale mostra un grafico dal 1977 anno al 2015 anno. Jamaica. I dati fino ad 1976 anno non disponibili. Il numero di osservazioni attuali secondo i date: 39.
La fonte (nome):
Indicatori dello sviluppo mondiale
La fonte (organizzazione):
Development Assistance Committee of the Organisation for Economic Co-operation and Development, Geographical Distribution of Financial Flows to Developing Countries, Development Co-operation Report, and International Development Statistics database. Data are available online at: www.oecd.org/dac/stats/idsonline. World Bank imports of good and services estimates are used for the denominator.
Categorie:
Aid Effectiveness
sono stati aggiornati
23 apr 2017 anni
Indicatori delle variazioni dei valori per anni
Minima:
-0.499
1 gen 2000 anni
Massimo:
11.091
1 gen 1987 anni
Alla data di osservazione
Valore
Variazione assoluta
La variazione rispetto al valore precedente
1 gen 1977 anni
2.065
+2.065
0.0%
1 gen 1978 anni
3.087
+1.022
49.52%
1 gen 1979 anni
9.783
+6.696
216.88%
1 gen 1980 anni
8.492
-1.292
-13.2%
1 gen 1981 anni
7.463
-1.029
-12.11%
1 gen 1982 anni
7.851
+0.389
5.21%
1 gen 1983 anni
9.326
+1.474
18.78%
1 gen 1984 anni
10.079
+0.753
8.08%
1 gen 1985 anni
9.512
-0.567
-5.63%
1 gen 1986 anni
9.423
-0.089
-0.93%
1 gen 1987 anni
11.091
+1.668
17.7%
1 gen 1988 anni
8.578
-2.513
-22.66%
1 gen 1989 anni
8.553
-0.025
-0.29%
1 gen 1990 anni
9.362
+0.809
9.46%
1 gen 1991 anni
9.243
-0.118
-1.26%
1 gen 1992 anni
5.782
-3.461
-37.45%
1 gen 1993 anni
4.507
-1.276
-22.06%
1 gen 1994 anni
3.262
-1.244
-27.61%
1 gen 1995 anni
3.263
+0.001
0.02%
1 gen 1996 anni
2.537
-0.726
-22.24%
1 gen 1997 anni
1.365
-1.172
-46.2%
1 gen 1998 anni
1.581
+0.216
15.86%
1 gen 1999 anni
0.412
-1.169
-73.92%
1 gen 2000 anni
-0.499
-0.912
-220.97%
1 gen 2001 anni
0.172
+0.671
-134.52%
1 gen 2002 anni
1.03
+0.858
498.03%
1 gen 2003 anni
0.429
-0.601
-58.38%
1 gen 2004 anni
0.114
-0.314
-73.33%
1 gen 2005 anni
1.351
+1.237
1.08 Mille.%
1 gen 2006 anni
0.568
-0.783
-57.97%
1 gen 2007 anni
0.46
-0.108
-19.07%
1 gen 2008 anni
0.29
-0.169
-36.8%
1 gen 2009 anni
0.782
+0.492
169.32%
1 gen 2010 anni
2.057
+1.274
162.93%
1 gen 2011 anni
1.96
-0.096
-4.68%
1 gen 2012 anni
0.455
-1.505
-76.79%
1 gen 2013 anni
0.318
-0.137
-30.05%
1 gen 2014 anni
0.864
+0.546
171.54%
1 gen 2015 anni
1.148
+0.283
32.76%
Classificazione dei paesi secondo i statistiche attuali per anni


Commenti: