29
/it/
it
AIzaSyAYiBZKx7MnpbEhh9jyipgxe19OcubqV5w
April 1, 2024
231434
Rwanda
RWA
true
2
1
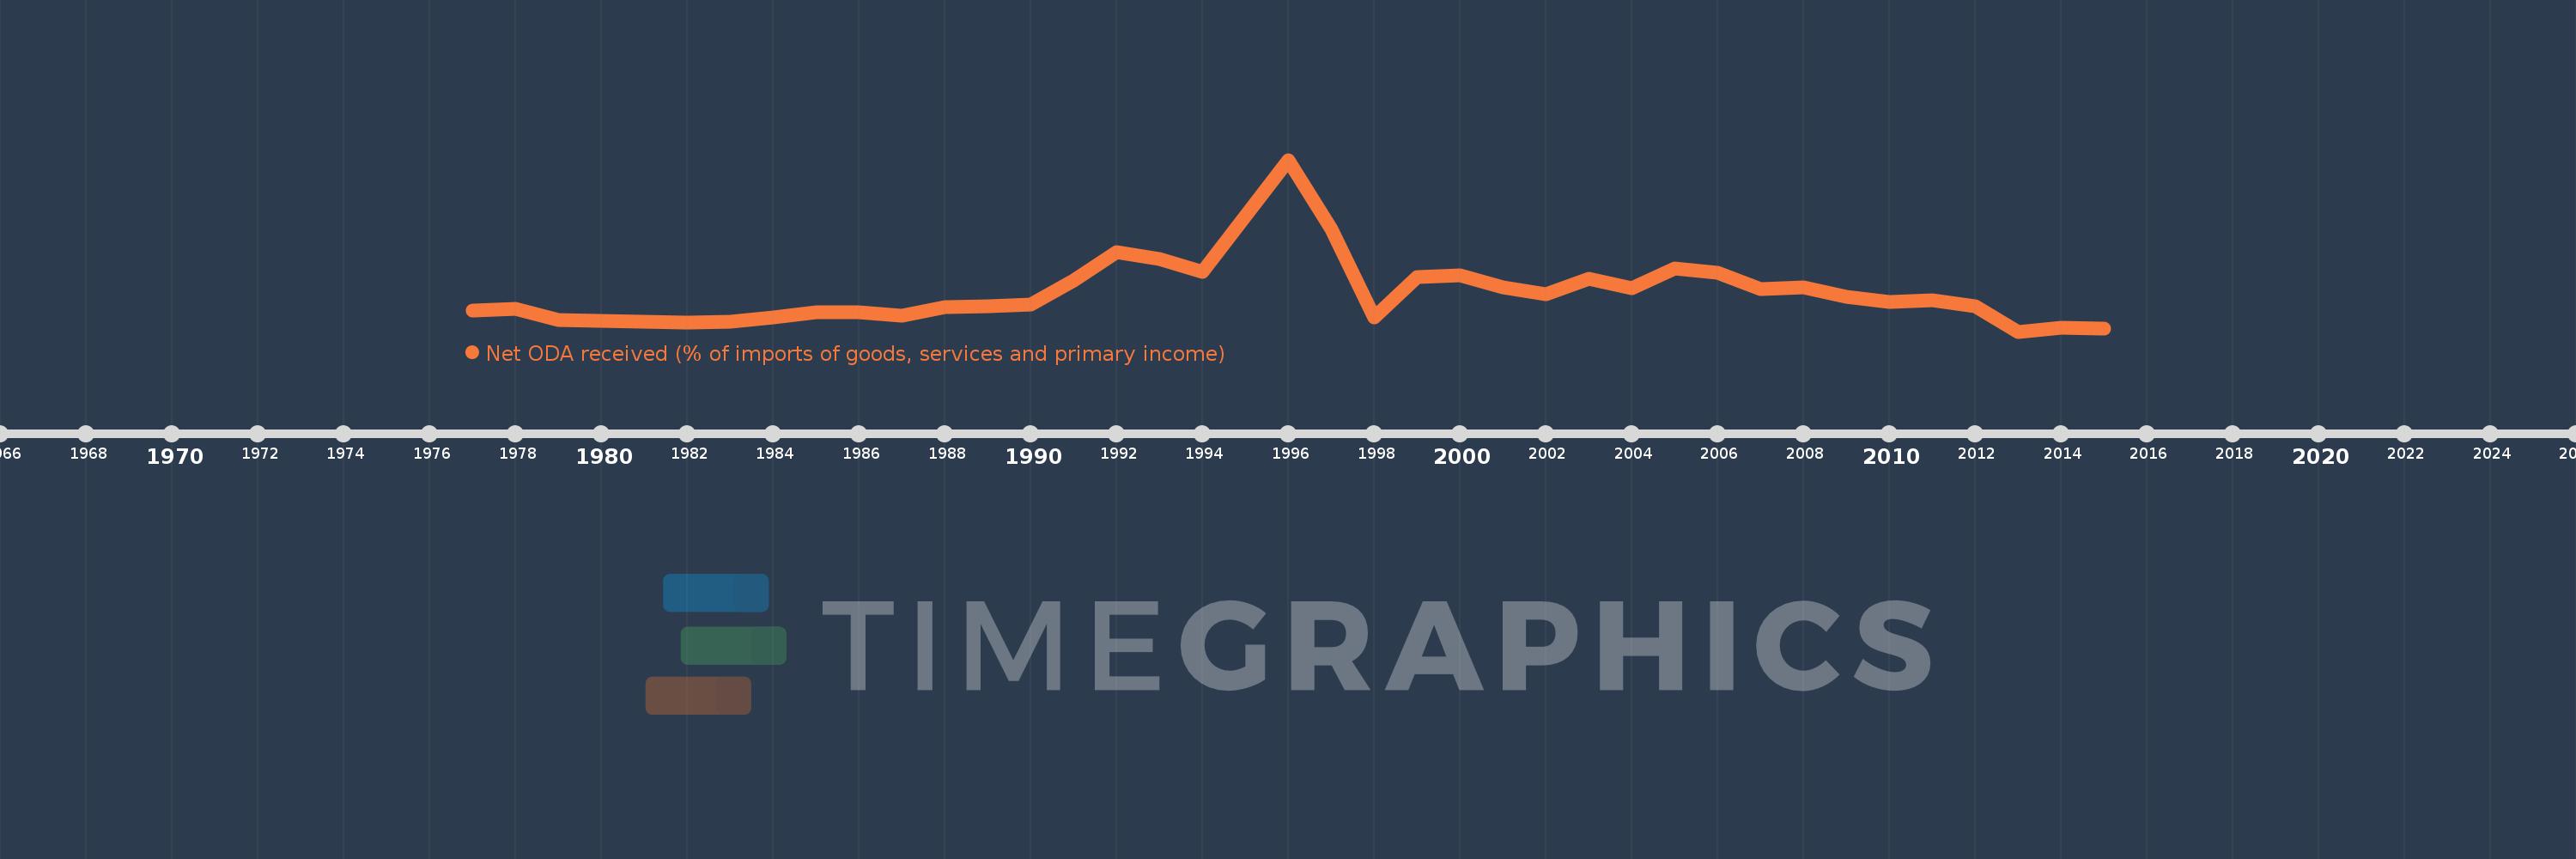
Net ODA received (% of imports of goods, services and primary income)
2015,2014,2013,2012,2011,2010,2009,2008,2007,2006,2005,2004,2003,2002,2001,2000,1999,1998,1997,1996,1994,1993,1992,1991,1990,1989,1988,1987,1986,1985,1984,1983,1982,1981,1980,1979,1978,1977
Queste statistiche in altri paesi:
AfghanistanAlbaniaAlgeriaAngolaAntigua and BarbudaArab WorldArgentinaArmeniaArubaAzerbaijanBahamas, TheBahrainBangladeshBarbadosBelarusBelizeBeninBhutanBoliviaBosnia and HerzegovinaBotswanaBrazilBurkina FasoBurundiCabo VerdeCambodiaCameroonCaribbean small statesCentral African RepublicCentral Europe and the BalticsChadChileChinaColombiaComorosCongo, Dem. Rep.Congo, Rep.Costa RicaCote d'IvoireCroatiaCyprusDjiboutiDominicaDominican RepublicEast Asia & PacificEast Asia & Pacific (excluding high income)East Asia & Pacific (IDA & IBRD countries)EcuadorEgypt, Arab Rep.El SalvadorEquatorial GuineaEritreaEthiopiaEuro areaEurope & Central AsiaEurope & Central Asia (excluding high income)Europe & Central Asia (IDA & IBRD countries)European UnionFijiFragile and conflict affected situationsGabonGambia, TheGeorgiaGhanaGrenadaGuatemalaGuineaGuinea-BissauGuyanaHaitiHeavily indebted poor countries (HIPC)High incomeHondurasIBRD onlyIDA & IBRD totalIDA blendIDA onlyIDA totalIndiaIndonesiaIran, Islamic Rep.IraqIsraelJamaicaJordanKazakhstanKenyaKiribatiKorea, Rep.KosovoKuwaitKyrgyz RepublicLao PDRLatin America & Caribbean Latin America & Caribbean (excluding high income)Latin America & the Caribbean (IDA & IBRD countries)Least developed countries: UN classificationLebanonLesothoLiberiaLibyaLow & middle incomeLow incomeLower middle incomeMacedonia, FYRMadagascarMalawiMalaysiaMaldivesMaliMaltaMarshall IslandsMauritaniaMauritiusMexicoMicronesia, Fed. Sts.Middle East & North Africa (excluding high income)Middle East & North Africa (IDA & IBRD countries)Middle incomeMoldovaMongoliaMontenegroMoroccoMozambiqueMyanmarNamibiaNepalNicaraguaNigerNigeriaNorth AmericaOECD membersOmanOther small statesPacific island small statesPakistanPalauPanamaPapua New GuineaParaguayPeruPhilippinesRwandaSamoaSao Tome and PrincipeSaudi ArabiaSenegalSerbiaSeychellesSierra LeoneSingaporeSloveniaSmall statesSolomon IslandsSouth AfricaSouth AsiaSouth Asia (IDA & IBRD)South SudanSri LankaSt. Kitts and NevisSt. LuciaSt. Vincent and the GrenadinesSub-Saharan Africa Sub-Saharan Africa (excluding high income)Sub-Saharan Africa (IDA & IBRD countries)SudanSurinameSwazilandSyrian Arab RepublicTajikistanTanzaniaThailandTimor-LesteTogoTongaTrinidad and TobagoTunisiaTurkeyTuvaluUgandaUkraineUpper middle incomeUruguayVanuatuVenezuela, RBVietnamWest Bank and GazaWorldYemen, Rep.ZambiaZimbabwe Linea del tempo:
Questa scala temporale mostra un grafico dal 1977 anno al 2015 anno. Rwanda. I dati fino ad 1976 anno non disponibili. Il numero di osservazioni attuali secondo i date: 38.
La fonte (nome):
Indicatori dello sviluppo mondiale
La fonte (organizzazione):
Development Assistance Committee of the Organisation for Economic Co-operation and Development, Geographical Distribution of Financial Flows to Developing Countries, Development Co-operation Report, and International Development Statistics database. Data are available online at: www.oecd.org/dac/stats/idsonline. World Bank imports of good and services estimates are used for the denominator.
Categorie:
Aid Effectiveness
sono stati aggiornati
23 apr 2017 anni
Indicatori delle variazioni dei valori per anni
Minima:
34.194
1 gen 2013 anni
Massimo:
177.514
1 gen 1996 anni
Alla data di osservazione
Valore
Variazione assoluta
La variazione rispetto al valore precedente
1 gen 1977 anni
51.738
+51.738
0.0%
1 gen 1978 anni
53.079
+1.341
2.59%
1 gen 1979 anni
44.203
-8.876
-16.72%
1 gen 1980 anni
43.086
-1.117
-2.53%
1 gen 1981 anni
42.694
-0.392
-0.91%
1 gen 1982 anni
41.655
-1.039
-2.43%
1 gen 1983 anni
42.503
+0.848
2.04%
1 gen 1984 anni
46.312
+3.809
8.96%
1 gen 1985 anni
50.056
+3.744
8.08%
1 gen 1986 anni
50.37
+0.313
0.63%
1 gen 1987 anni
47.65
-2.72
-5.4%
1 gen 1988 anni
54.384
+6.734
14.13%
1 gen 1989 anni
55.212
+0.828
1.52%
1 gen 1990 anni
57.08
+1.868
3.38%
1 gen 1991 anni
76.847
+19.768
34.63%
1 gen 1992 anni
100.654
+23.806
30.98%
1 gen 1993 anni
94.434
-6.22
-6.18%
1 gen 1994 anni
83.743
-10.691
-11.32%
1 gen 1996 anni
177.514
+93.771
111.98%
1 gen 1997 anni
119.967
-57.547
-32.42%
1 gen 1998 anni
45.785
-74.182
-61.84%
1 gen 1999 anni
79.825
+34.04
74.35%
1 gen 2000 anni
81.353
+1.528
1.91%
1 gen 2001 anni
71.162
-10.19
-12.53%
1 gen 2002 anni
65.092
-6.07
-8.53%
1 gen 2003 anni
78.564
+13.472
20.7%
1 gen 2004 anni
70.256
-8.308
-10.58%
1 gen 2005 anni
86.849
+16.593
23.62%
1 gen 2006 anni
83.354
-3.495
-4.02%
1 gen 2007 anni
69.948
-13.406
-16.08%
1 gen 2008 anni
70.885
+0.937
1.34%
1 gen 2009 anni
63.019
-7.867
-11.1%
1 gen 2010 anni
58.906
-4.113
-6.53%
1 gen 2011 anni
60.391
+1.485
2.52%
1 gen 2012 anni
55.539
-4.852
-8.03%
1 gen 2013 anni
34.194
-21.345
-38.43%
1 gen 2014 anni
37.263
+3.069
8.98%
1 gen 2015 anni
36.594
-0.669
-1.8%
Classificazione dei paesi secondo i statistiche attuali per anni


Commenti: