29
/it/
it
AIzaSyAYiBZKx7MnpbEhh9jyipgxe19OcubqV5w
April 1, 2024
264626
Togo
TGO
true
2
1
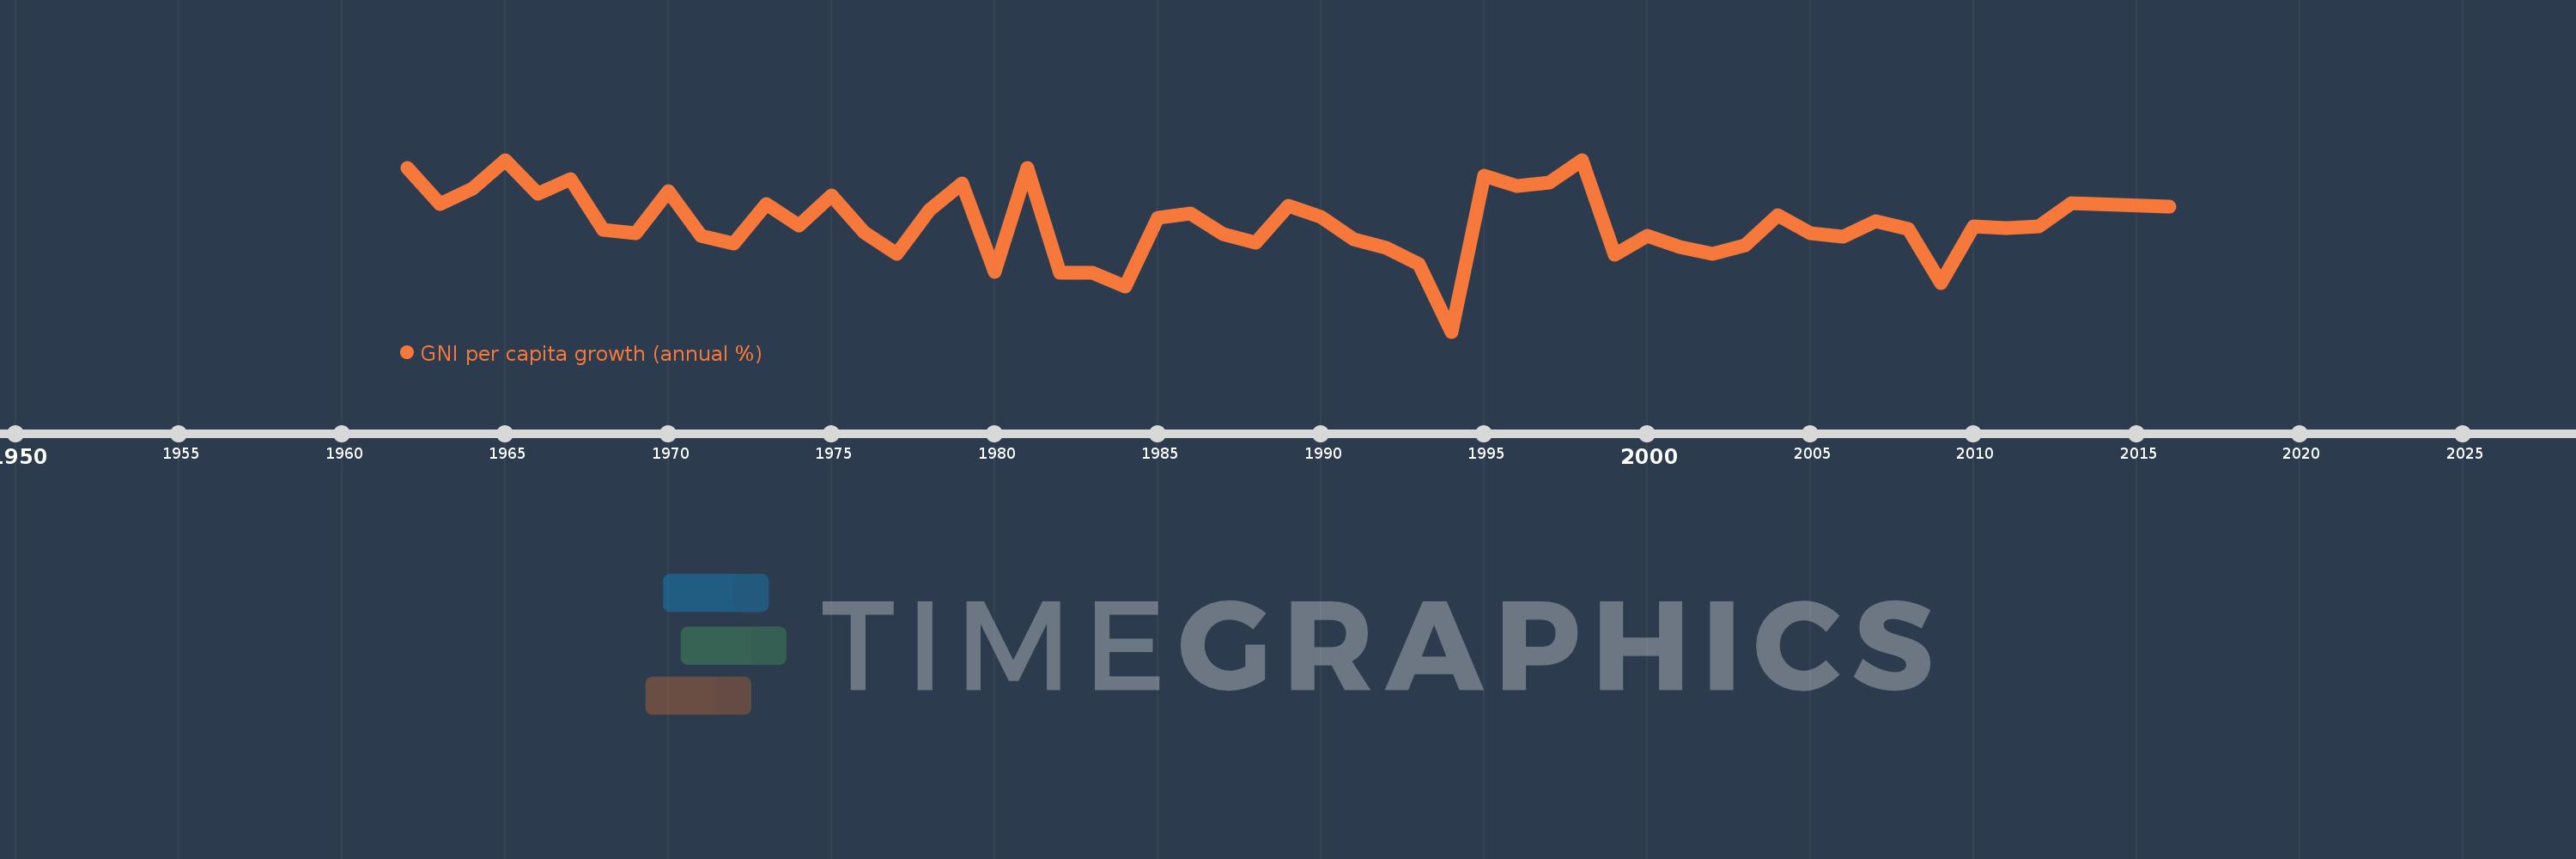
GNI per capita growth (annual %)
2016,2013,2012,2011,2010,2009,2008,2007,2006,2005,2004,2003,2002,2001,2000,1999,1998,1997,1996,1995,1994,1993,1992,1991,1990,1989,1988,1987,1986,1985,1984,1983,1982,1981,1980,1979,1978,1977,1976,1975,1974,1973,1972,1971,1970,1969,1968,1967,1966,1965,1964,1963,1962
Queste statistiche in altri paesi:
AlbaniaAlgeriaAngolaAntigua and BarbudaArab WorldArgentinaArmeniaAustraliaAustriaAzerbaijanBahamas, TheBahrainBangladeshBarbadosBelarusBelgiumBelizeBeninBhutanBoliviaBosnia and HerzegovinaBotswanaBrazilBrunei DarussalamBulgariaBurkina FasoBurundiCabo VerdeCambodiaCameroonCanadaCaribbean small statesCentral Europe and the BalticsChadChileChinaColombiaComorosCongo, Dem. Rep.Congo, Rep.Costa RicaCote d'IvoireCroatiaCubaCyprusCzech RepublicDenmarkDjiboutiDominican RepublicEarly-demographic dividendEast Asia & PacificEast Asia & Pacific (excluding high income)East Asia & Pacific (IDA & IBRD countries)EcuadorEgypt, Arab Rep.El SalvadorEquatorial GuineaEritreaEstoniaEthiopiaEuro areaEurope & Central AsiaEurope & Central Asia (excluding high income)Europe & Central Asia (IDA & IBRD countries)European UnionFijiFinlandFranceGabonGambia, TheGeorgiaGermanyGhanaGreeceGuatemalaGuineaGuinea-BissauHaitiHeavily indebted poor countries (HIPC)High incomeHondurasHong Kong SAR, ChinaHungaryIBRD onlyIcelandIDA & IBRD totalIDA blendIDA onlyIDA totalIndiaIndonesiaIran, Islamic Rep.IrelandIsraelItalyJamaicaJapanJordanKazakhstanKenyaKorea, Rep.KosovoKuwaitKyrgyz RepublicLao PDRLate-demographic dividendLatin America & Caribbean Latin America & Caribbean (excluding high income)Latin America & the Caribbean (IDA & IBRD countries)LatviaLeast developed countries: UN classificationLebanonLiberiaLibyaLithuaniaLow & middle incomeLow incomeLower middle incomeLuxembourgMacao SAR, ChinaMacedonia, FYRMadagascarMalawiMalaysiaMaliMaltaMauritaniaMauritiusMexicoMiddle East & North AfricaMiddle East & North Africa (excluding high income)Middle East & North Africa (IDA & IBRD countries)Middle incomeMoldovaMongoliaMontenegroMoroccoMozambiqueMyanmarNamibiaNepalNetherlandsNew ZealandNicaraguaNigerNigeriaNorth AmericaNorwayOECD membersOmanOther small statesPakistanPanamaPapua New GuineaParaguayPeruPhilippinesPolandPortugalPost-demographic dividendPre-demographic dividendPuerto RicoQatarRomaniaRussian FederationRwandaSamoaSaudi ArabiaSenegalSerbiaSeychellesSierra LeoneSingaporeSlovak RepublicSloveniaSmall statesSomaliaSouth AfricaSouth AsiaSouth Asia (IDA & IBRD)South SudanSpainSri LankaSub-Saharan Africa Sub-Saharan Africa (excluding high income)Sub-Saharan Africa (IDA & IBRD countries)SudanSurinameSwazilandSwedenSwitzerlandSyrian Arab RepublicTajikistanTanzaniaThailandTimor-LesteTogoTrinidad and TobagoTunisiaTurkeyTurkmenistanUgandaUkraineUnited Arab EmiratesUnited KingdomUnited StatesUpper middle incomeUruguayUzbekistanVanuatuVenezuela, RBVietnamWest Bank and GazaWorldZambiaZimbabwe Linea del tempo:
Questa scala temporale mostra un grafico dal 1962 anno al 2016 anno. Togo. I dati fino ad 1961 anno non disponibili. Il numero di osservazioni attuali secondo i date: 53.
La fonte (nome):
Indicatori dello sviluppo mondiale
La fonte (organizzazione):
World Bank national accounts data, and OECD National Accounts data files.
Categorie:
Economy & Growth
sono stati aggiornati
23 apr 2017 anni
Indicatori delle variazioni dei valori per anni
Minima:
-17.33
1 gen 1994 anni
Massimo:
11.577
1 gen 1965 anni
Alla data di osservazione
Valore
Variazione assoluta
La variazione rispetto al valore precedente
1 gen 1962 anni
10.181
+10.181
0.0%
1 gen 1963 anni
4.147
-6.033
-59.26%
1 gen 1964 anni
6.671
+2.524
60.86%
1 gen 1965 anni
11.577
+4.906
73.54%
1 gen 1966 anni
5.888
-5.689
-49.14%
1 gen 1967 anni
8.337
+2.449
41.59%
1 gen 1968 anni
-0.156
-8.493
-101.87%
1 gen 1969 anni
-0.772
-0.616
394.22%
1 gen 1970 anni
6.243
+7.015
-908.36%
1 gen 1971 anni
-1.179
-7.422
-118.88%
1 gen 1972 anni
-2.529
-1.351
114.62%
1 gen 1973 anni
4.075
+6.604
-261.1%
1 gen 1974 anni
0.531
-3.544
-86.98%
1 gen 1975 anni
5.648
+5.117
964.4%
1 gen 1976 anni
-0.646
-6.294
-111.44%
1 gen 1977 anni
-4.246
-3.599
557.03%
1 gen 1978 anni
3.163
+7.409
-174.5%
1 gen 1979 anni
7.631
+4.468
141.26%
1 gen 1980 anni
-7.336
-14.967
-196.14%
1 gen 1981 anni
10.222
+17.558
-239.33%
1 gen 1982 anni
-7.487
-17.709
-173.25%
1 gen 1983 anni
-7.402
+0.085
-1.14%
1 gen 1984 anni
-9.73
-2.328
31.45%
1 gen 1985 anni
1.792
+11.522
-118.42%
1 gen 1986 anni
2.476
+0.684
38.19%
1 gen 1987 anni
-0.884
-3.361
-135.72%
1 gen 1988 anni
-2.398
-1.513
171.11%
1 gen 1989 anni
3.866
+6.263
-261.21%
1 gen 1990 anni
1.904
-1.962
-50.76%
1 gen 1991 anni
-1.823
-3.727
-195.77%
1 gen 1992 anni
-3.236
-1.413
77.52%
1 gen 1993 anni
-6.026
-2.79
86.19%
1 gen 1994 anni
-17.33
-11.304
187.59%
1 gen 1995 anni
8.884
+26.214
-151.26%
1 gen 1996 anni
7.117
-1.767
-19.88%
1 gen 1997 anni
7.683
+0.566
7.95%
1 gen 1998 anni
11.483
+3.799
49.45%
1 gen 1999 anni
-4.45
-15.933
-138.76%
1 gen 2000 anni
-1.178
+3.273
-73.53%
1 gen 2001 anni
-3.077
-1.899
161.23%
1 gen 2002 anni
-4.258
-1.181
38.38%
1 gen 2003 anni
-2.796
+1.461
-34.32%
1 gen 2004 anni
2.28
+5.076
-181.52%
1 gen 2005 anni
-0.849
-3.129
-137.25%
1 gen 2006 anni
-1.363
-0.514
60.5%
1 gen 2007 anni
1.248
+2.611
-191.59%
1 gen 2008 anni
-0.004
-1.253
-100.35%
1 gen 2009 anni
-9.208
-9.203
213.0 Mille.%
1 gen 2010 anni
0.417
+9.625
-104.53%
1 gen 2011 anni
0.098
-0.319
-76.49%
1 gen 2012 anni
0.337
+0.239
243.59%
1 gen 2013 anni
4.325
+3.989
1.18 Mille.%
1 gen 2016 anni
3.671
-0.654
-15.12%
Classificazione dei paesi secondo i statistiche attuali per anni


Commenti: