29
/it/
it
AIzaSyAYiBZKx7MnpbEhh9jyipgxe19OcubqV5w
April 1, 2024
151599
Hong Kong SAR, China
HKG
true
2
1
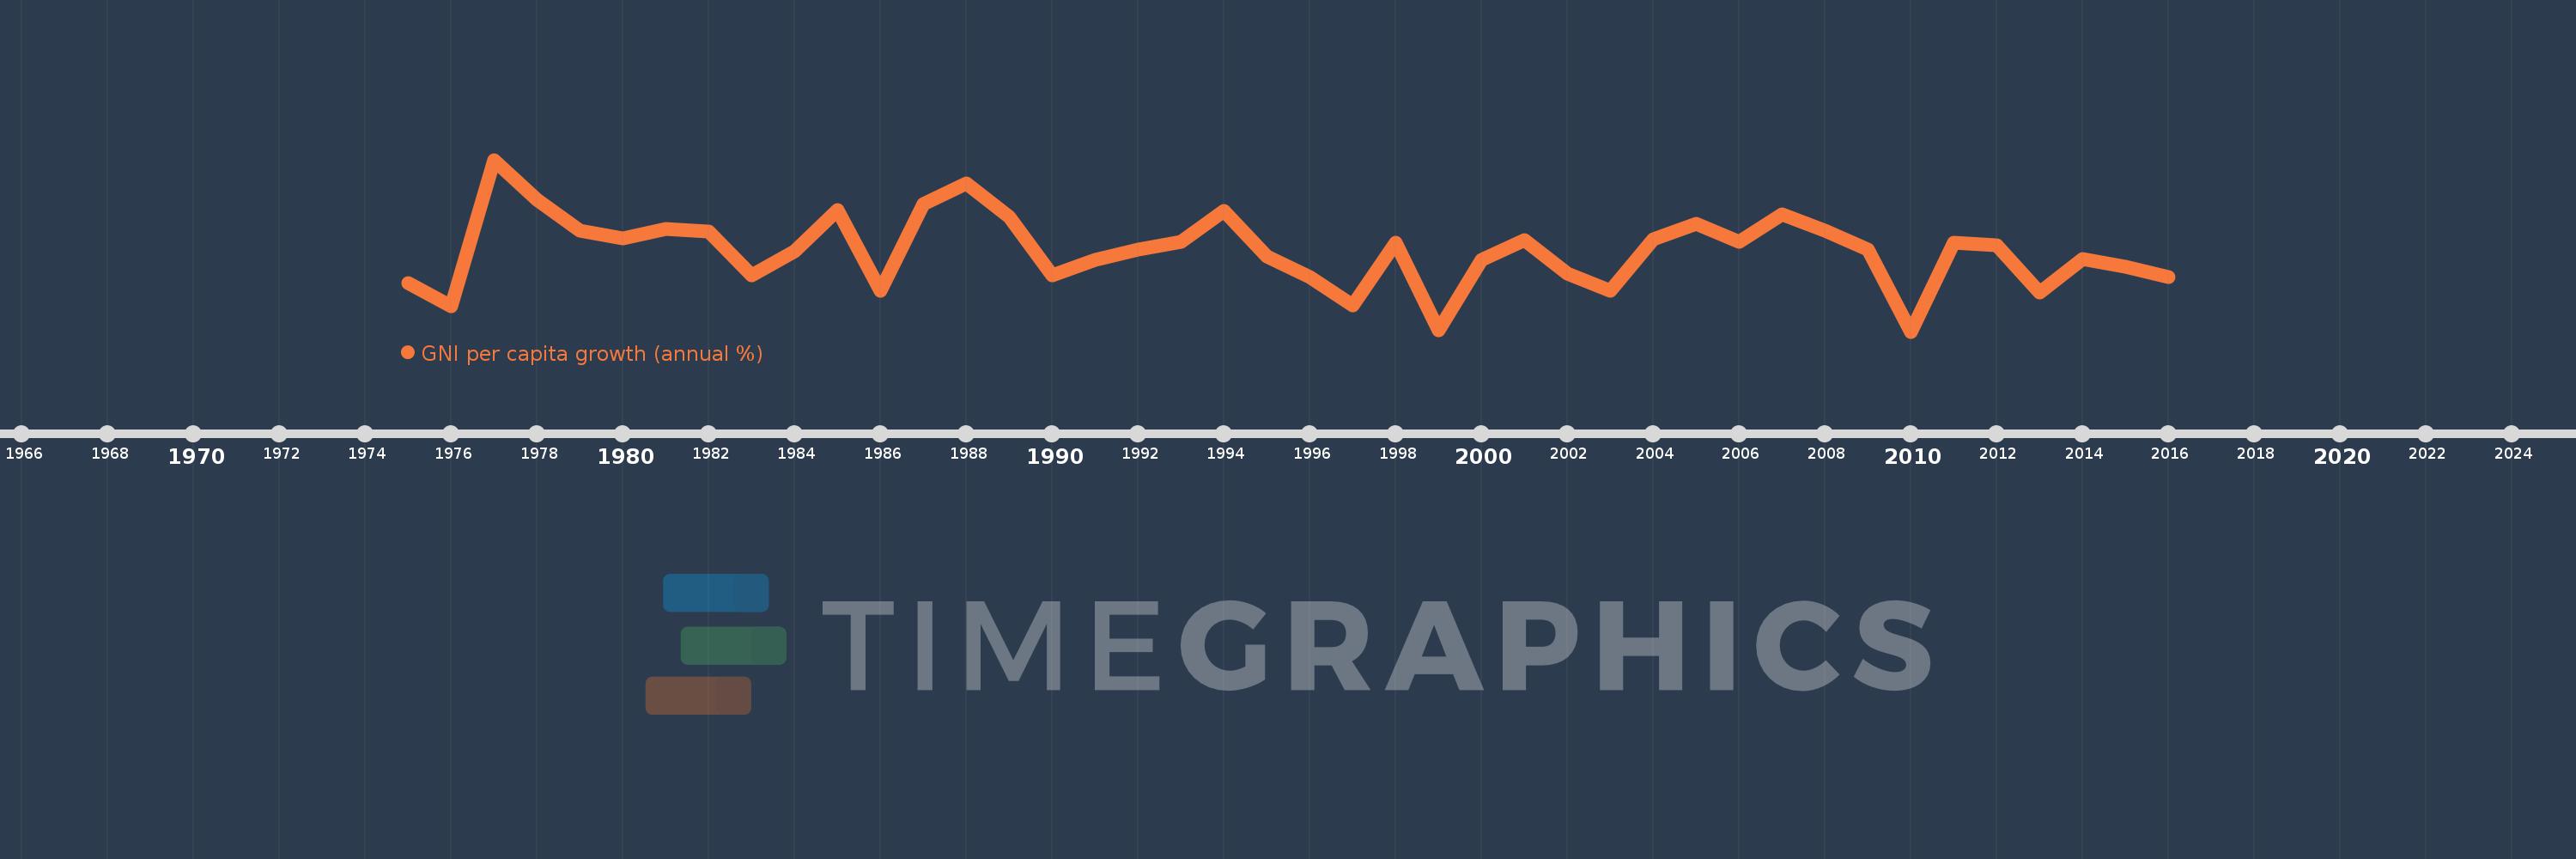
GNI per capita growth (annual %)
2016,2015,2014,2013,2012,2011,2010,2009,2008,2007,2006,2005,2004,2003,2002,2001,2000,1999,1998,1997,1996,1995,1994,1993,1992,1991,1990,1989,1988,1987,1986,1985,1984,1983,1982,1981,1980,1979,1978,1977,1976,1975
Queste statistiche in altri paesi:
AlbaniaAlgeriaAngolaAntigua and BarbudaArab WorldArgentinaArmeniaAustraliaAustriaAzerbaijanBahamas, TheBahrainBangladeshBarbadosBelarusBelgiumBelizeBeninBhutanBoliviaBosnia and HerzegovinaBotswanaBrazilBrunei DarussalamBulgariaBurkina FasoBurundiCabo VerdeCambodiaCameroonCanadaCaribbean small statesCentral Europe and the BalticsChadChileChinaColombiaComorosCongo, Dem. Rep.Congo, Rep.Costa RicaCote d'IvoireCroatiaCubaCyprusCzech RepublicDenmarkDjiboutiDominican RepublicEarly-demographic dividendEast Asia & PacificEast Asia & Pacific (excluding high income)East Asia & Pacific (IDA & IBRD countries)EcuadorEgypt, Arab Rep.El SalvadorEquatorial GuineaEritreaEstoniaEthiopiaEuro areaEurope & Central AsiaEurope & Central Asia (excluding high income)Europe & Central Asia (IDA & IBRD countries)European UnionFijiFinlandFranceGabonGambia, TheGeorgiaGermanyGhanaGreeceGuatemalaGuineaGuinea-BissauHaitiHeavily indebted poor countries (HIPC)High incomeHondurasHong Kong SAR, ChinaHungaryIBRD onlyIcelandIDA & IBRD totalIDA blendIDA onlyIDA totalIndiaIndonesiaIran, Islamic Rep.IrelandIsraelItalyJamaicaJapanJordanKazakhstanKenyaKorea, Rep.KosovoKuwaitKyrgyz RepublicLao PDRLate-demographic dividendLatin America & Caribbean Latin America & Caribbean (excluding high income)Latin America & the Caribbean (IDA & IBRD countries)LatviaLeast developed countries: UN classificationLebanonLiberiaLibyaLithuaniaLow & middle incomeLow incomeLower middle incomeLuxembourgMacao SAR, ChinaMacedonia, FYRMadagascarMalawiMalaysiaMaliMaltaMauritaniaMauritiusMexicoMiddle East & North AfricaMiddle East & North Africa (excluding high income)Middle East & North Africa (IDA & IBRD countries)Middle incomeMoldovaMongoliaMontenegroMoroccoMozambiqueMyanmarNamibiaNepalNetherlandsNew ZealandNicaraguaNigerNigeriaNorth AmericaNorwayOECD membersOmanOther small statesPakistanPanamaPapua New GuineaParaguayPeruPhilippinesPolandPortugalPost-demographic dividendPre-demographic dividendPuerto RicoQatarRomaniaRussian FederationRwandaSamoaSaudi ArabiaSenegalSerbiaSeychellesSierra LeoneSingaporeSlovak RepublicSloveniaSmall statesSomaliaSouth AfricaSouth AsiaSouth Asia (IDA & IBRD)South SudanSpainSri LankaSub-Saharan Africa Sub-Saharan Africa (excluding high income)Sub-Saharan Africa (IDA & IBRD countries)SudanSurinameSwazilandSwedenSwitzerlandSyrian Arab RepublicTajikistanTanzaniaThailandTimor-LesteTogoTrinidad and TobagoTunisiaTurkeyTurkmenistanUgandaUkraineUnited Arab EmiratesUnited KingdomUnited StatesUpper middle incomeUruguayUzbekistanVanuatuVenezuela, RBVietnamWest Bank and GazaWorldZambiaZimbabwe Linea del tempo:
Questa scala temporale mostra un grafico dal 1975 anno al 2016 anno. Hong Kong SAR, China. I dati fino ad 1974 anno non disponibili. Il numero di osservazioni attuali secondo i date: 42.
La fonte (nome):
Indicatori dello sviluppo mondiale
La fonte (organizzazione):
World Bank national accounts data, and OECD National Accounts data files.
Categorie:
Economy & Growth
sono stati aggiornati
23 apr 2017 anni
Indicatori delle variazioni dei valori per anni
Minima:
-5.368
1 gen 2010 anni
Massimo:
14.698
1 gen 1977 anni
Alla data di osservazione
Valore
Variazione assoluta
La variazione rispetto al valore precedente
1 gen 1975 anni
0.266
+0.266
0.0%
1 gen 1976 anni
-2.454
-2.72
-1.02 Mille.%
1 gen 1977 anni
14.698
+17.152
-698.94%
1 gen 1978 anni
10.068
-4.63
-31.5%
1 gen 1979 anni
6.442
-3.626
-36.01%
1 gen 1980 anni
5.496
-0.946
-14.68%
1 gen 1981 anni
6.584
+1.088
19.8%
1 gen 1982 anni
6.363
-0.221
-3.36%
1 gen 1983 anni
1.172
-5.191
-81.58%
1 gen 1984 anni
4.031
+2.858
243.87%
1 gen 1985 anni
8.824
+4.793
118.93%
1 gen 1986 anni
-0.622
-9.446
-107.05%
1 gen 1987 anni
9.546
+10.169
-1.63 Mille.%
1 gen 1988 anni
11.896
+2.35
24.62%
1 gen 1989 anni
8.07
-3.826
-32.17%
1 gen 1990 anni
1.16
-6.91
-85.63%
1 gen 1991 anni
3.03
+1.87
161.31%
1 gen 1992 anni
4.198
+1.168
38.54%
1 gen 1993 anni
5.12
+0.922
21.97%
1 gen 1994 anni
8.728
+3.608
70.47%
1 gen 1995 anni
3.421
-5.307
-60.8%
1 gen 1996 anni
0.984
-2.437
-71.23%
1 gen 1997 anni
-2.329
-3.313
-336.62%
1 gen 1998 anni
4.98
+7.309
-313.83%
1 gen 1999 anni
-5.19
-10.171
-204.22%
1 gen 2000 anni
2.971
+8.161
-157.24%
1 gen 2001 anni
5.31
+2.339
78.72%
1 gen 2002 anni
1.446
-3.863
-72.76%
1 gen 2003 anni
-0.566
-2.013
-139.14%
1 gen 2004 anni
5.406
+5.972
-1.05 Mille.%
1 gen 2005 anni
7.272
+1.866
34.52%
1 gen 2006 anni
5.141
-2.13
-29.3%
1 gen 2007 anni
8.328
+3.186
61.98%
1 gen 2008 anni
6.47
-1.858
-22.31%
1 gen 2009 anni
4.18
-2.29
-35.39%
1 gen 2010 anni
-5.368
-9.549
-228.43%
1 gen 2011 anni
5.021
+10.389
-193.52%
1 gen 2012 anni
4.73
-0.29
-5.78%
1 gen 2013 anni
-0.756
-5.486
-115.98%
1 gen 2014 anni
3.077
+3.833
-506.94%
1 gen 2015 anni
2.21
-0.867
-28.18%
1 gen 2016 anni
1.018
-1.192
-53.92%
Classificazione dei paesi secondo i statistiche attuali per anni


Commenti: