29
/it/
it
AIzaSyAYiBZKx7MnpbEhh9jyipgxe19OcubqV5w
April 1, 2024
135550
Gabon
GAB
true
2
1
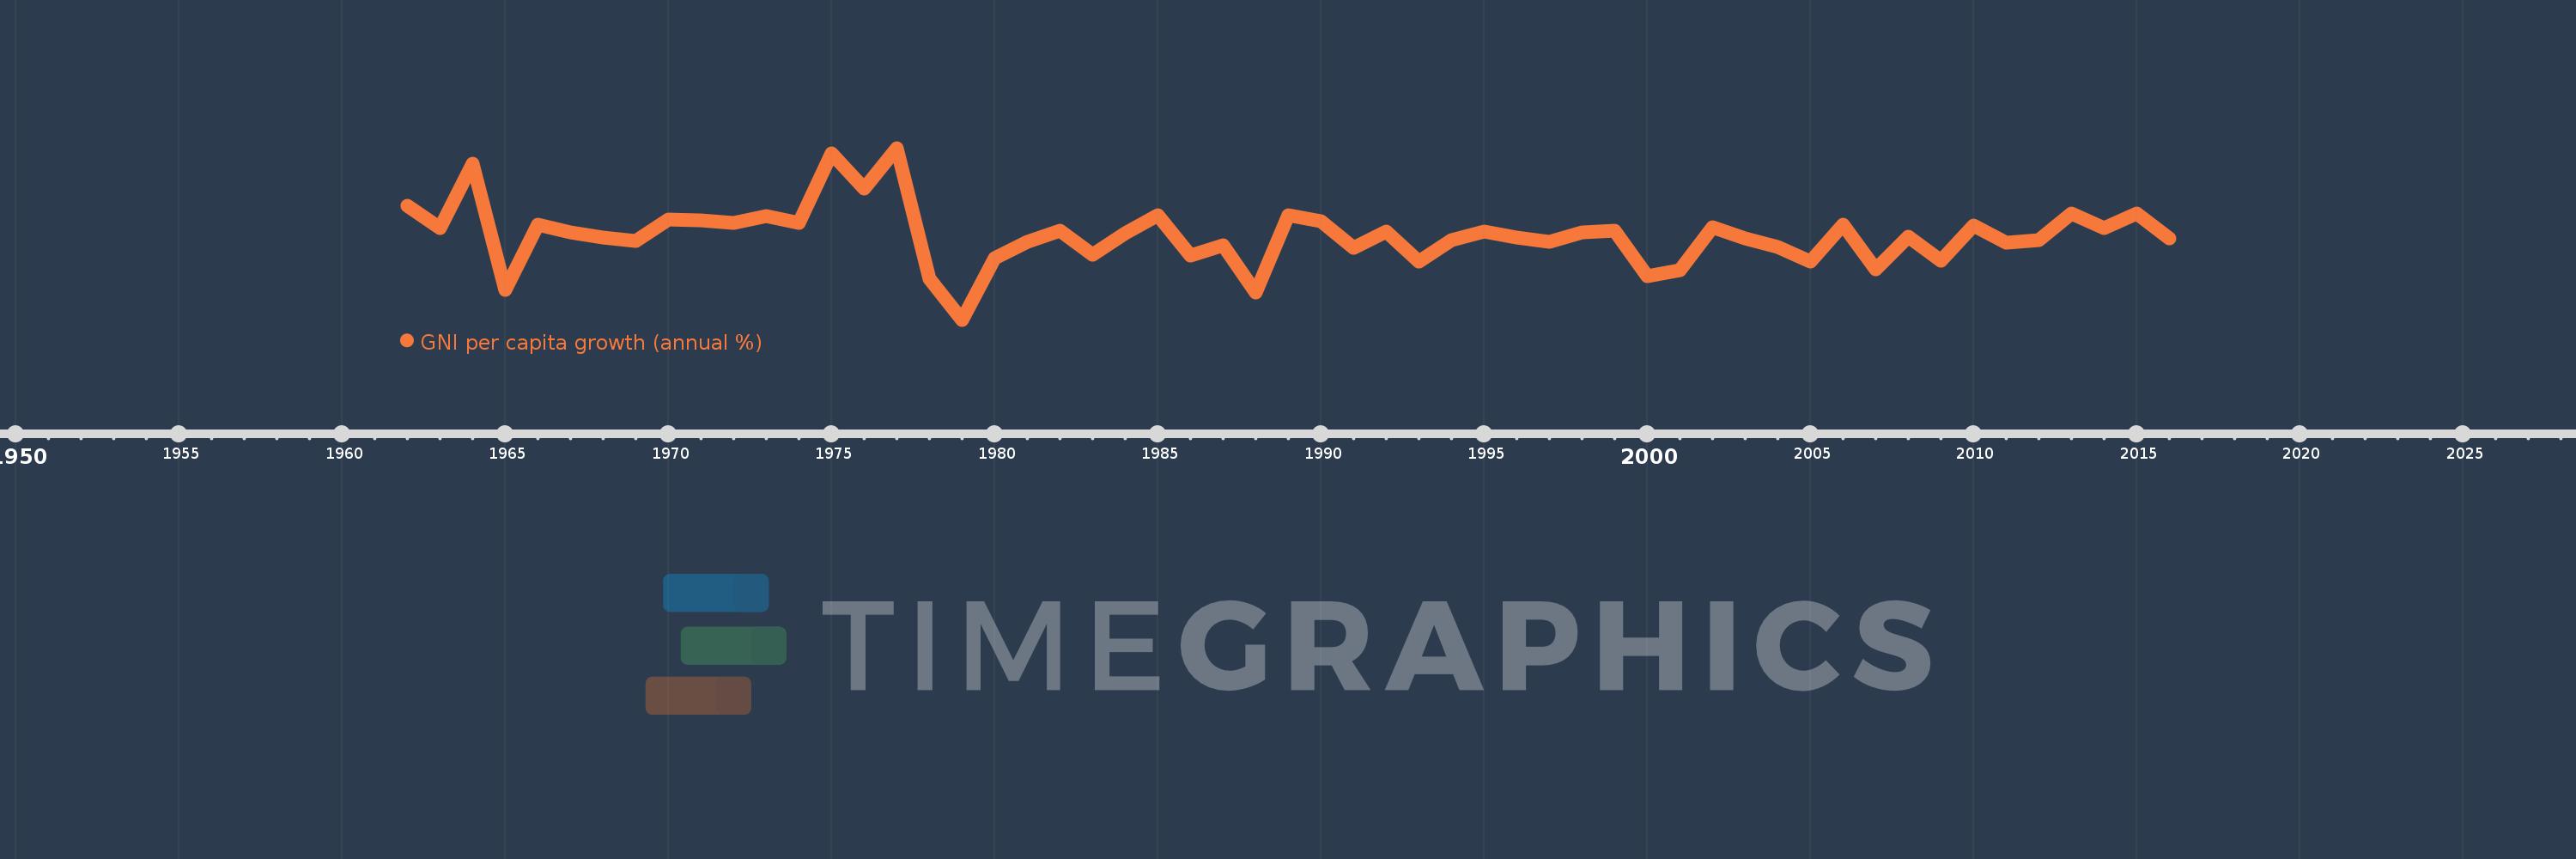
GNI per capita growth (annual %)
2016,2015,2014,2013,2012,2011,2010,2009,2008,2007,2006,2005,2004,2003,2002,2001,2000,1999,1998,1997,1996,1995,1994,1993,1992,1991,1990,1989,1988,1987,1986,1985,1984,1983,1982,1981,1980,1979,1978,1977,1976,1975,1974,1973,1972,1971,1970,1969,1968,1967,1966,1965,1964,1963,1962
Queste statistiche in altri paesi:
AlbaniaAlgeriaAngolaAntigua and BarbudaArab WorldArgentinaArmeniaAustraliaAustriaAzerbaijanBahamas, TheBahrainBangladeshBarbadosBelarusBelgiumBelizeBeninBhutanBoliviaBosnia and HerzegovinaBotswanaBrazilBrunei DarussalamBulgariaBurkina FasoBurundiCabo VerdeCambodiaCameroonCanadaCaribbean small statesCentral Europe and the BalticsChadChileChinaColombiaComorosCongo, Dem. Rep.Congo, Rep.Costa RicaCote d'IvoireCroatiaCubaCyprusCzech RepublicDenmarkDjiboutiDominican RepublicEarly-demographic dividendEast Asia & PacificEast Asia & Pacific (excluding high income)East Asia & Pacific (IDA & IBRD countries)EcuadorEgypt, Arab Rep.El SalvadorEquatorial GuineaEritreaEstoniaEthiopiaEuro areaEurope & Central AsiaEurope & Central Asia (excluding high income)Europe & Central Asia (IDA & IBRD countries)European UnionFijiFinlandFranceGabonGambia, TheGeorgiaGermanyGhanaGreeceGuatemalaGuineaGuinea-BissauHaitiHeavily indebted poor countries (HIPC)High incomeHondurasHong Kong SAR, ChinaHungaryIBRD onlyIcelandIDA & IBRD totalIDA blendIDA onlyIDA totalIndiaIndonesiaIran, Islamic Rep.IrelandIsraelItalyJamaicaJapanJordanKazakhstanKenyaKorea, Rep.KosovoKuwaitKyrgyz RepublicLao PDRLate-demographic dividendLatin America & Caribbean Latin America & Caribbean (excluding high income)Latin America & the Caribbean (IDA & IBRD countries)LatviaLeast developed countries: UN classificationLebanonLiberiaLibyaLithuaniaLow & middle incomeLow incomeLower middle incomeLuxembourgMacao SAR, ChinaMacedonia, FYRMadagascarMalawiMalaysiaMaliMaltaMauritaniaMauritiusMexicoMiddle East & North AfricaMiddle East & North Africa (excluding high income)Middle East & North Africa (IDA & IBRD countries)Middle incomeMoldovaMongoliaMontenegroMoroccoMozambiqueMyanmarNamibiaNepalNetherlandsNew ZealandNicaraguaNigerNigeriaNorth AmericaNorwayOECD membersOmanOther small statesPakistanPanamaPapua New GuineaParaguayPeruPhilippinesPolandPortugalPost-demographic dividendPre-demographic dividendPuerto RicoQatarRomaniaRussian FederationRwandaSamoaSaudi ArabiaSenegalSerbiaSeychellesSierra LeoneSingaporeSlovak RepublicSloveniaSmall statesSomaliaSouth AfricaSouth AsiaSouth Asia (IDA & IBRD)South SudanSpainSri LankaSub-Saharan Africa Sub-Saharan Africa (excluding high income)Sub-Saharan Africa (IDA & IBRD countries)SudanSurinameSwazilandSwedenSwitzerlandSyrian Arab RepublicTajikistanTanzaniaThailandTimor-LesteTogoTrinidad and TobagoTunisiaTurkeyTurkmenistanUgandaUkraineUnited Arab EmiratesUnited KingdomUnited StatesUpper middle incomeUruguayUzbekistanVanuatuVenezuela, RBVietnamWest Bank and GazaWorldZambiaZimbabwe Linea del tempo:
Questa scala temporale mostra un grafico dal 1962 anno al 2016 anno. Gabon. I dati fino ad 1961 anno non disponibili. Il numero di osservazioni attuali secondo i date: 55.
La fonte (nome):
Indicatori dello sviluppo mondiale
La fonte (organizzazione):
World Bank national accounts data, and OECD National Accounts data files.
Categorie:
Economy & Growth
sono stati aggiornati
23 apr 2017 anni
Indicatori delle variazioni dei valori per anni
Minima:
-29.316
1 gen 1979 anni
Massimo:
34.863
1 gen 1977 anni
Alla data di osservazione
Valore
Variazione assoluta
La variazione rispetto al valore precedente
1 gen 1962 anni
13.187
+13.187
0.0%
1 gen 1963 anni
5.076
-8.111
-61.51%
1 gen 1964 anni
29.05
+23.974
472.29%
1 gen 1965 anni
-18.217
-47.266
-162.71%
1 gen 1966 anni
6.237
+24.454
-134.24%
1 gen 1967 anni
3.4
-2.837
-45.49%
1 gen 1968 anni
1.311
-2.089
-61.44%
1 gen 1969 anni
0.217
-1.094
-83.42%
1 gen 1970 anni
8.198
+7.981
3.67 Mille.%
1 gen 1971 anni
7.875
-0.324
-3.95%
1 gen 1972 anni
6.711
-1.163
-14.77%
1 gen 1973 anni
9.571
+2.86
42.61%
1 gen 1974 anni
6.718
-2.854
-29.81%
1 gen 1975 anni
32.99
+26.272
391.1%
1 gen 1976 anni
19.699
-13.291
-40.29%
1 gen 1977 anni
34.863
+15.163
76.97%
1 gen 1978 anni
-14.114
-48.976
-140.48%
1 gen 1979 anni
-29.316
-15.202
107.71%
1 gen 1980 anni
-6.355
+22.961
-78.32%
1 gen 1981 anni
-0.163
+6.192
-97.44%
1 gen 1982 anni
3.822
+3.985
-2.44 Mille.%
1 gen 1983 anni
-5.072
-8.894
-232.72%
1 gen 1984 anni
2.86
+7.933
-156.39%
1 gen 1985 anni
9.788
+6.927
242.18%
1 gen 1986 anni
-5.267
-15.055
-153.81%
1 gen 1987 anni
-1.581
+3.686
-69.98%
1 gen 1988 anni
-19.156
-17.575
1.11 Mille.%
1 gen 1989 anni
9.756
+28.912
-150.93%
1 gen 1990 anni
7.64
-2.116
-21.69%
1 gen 1991 anni
-2.512
-10.152
-132.87%
1 gen 1992 anni
3.724
+6.235
-248.26%
1 gen 1993 anni
-7.747
-11.471
-308.05%
1 gen 1994 anni
0.386
+8.133
-104.98%
1 gen 1995 anni
3.645
+3.259
844.94%
1 gen 1996 anni
1.259
-2.386
-65.46%
1 gen 1997 anni
-0.13
-1.389
-110.31%
1 gen 1998 anni
3.179
+3.309
-2.55 Mille.%
1 gen 1999 anni
3.821
+0.642
20.19%
1 gen 2000 anni
-13.007
-16.828
-440.44%
1 gen 2001 anni
-10.935
+2.072
-15.93%
1 gen 2002 anni
5.356
+16.291
-148.98%
1 gen 2003 anni
1.212
-4.143
-77.37%
1 gen 2004 anni
-2.107
-3.319
-273.8%
1 gen 2005 anni
-7.644
-5.538
262.88%
1 gen 2006 anni
6.327
+13.971
-182.77%
1 gen 2007 anni
-10.457
-16.784
-265.27%
1 gen 2008 anni
1.592
+12.048
-115.22%
1 gen 2009 anni
-7.197
-8.788
-552.19%
1 gen 2010 anni
5.902
+13.099
-182.02%
1 gen 2011 anni
-0.508
-6.411
-108.61%
1 gen 2012 anni
0.337
+0.845
-166.3%
1 gen 2013 anni
10.283
+9.946
2.95 Mille.%
1 gen 2014 anni
5.015
-5.269
-51.23%
1 gen 2015 anni
10.435
+5.42
108.08%
1 gen 2016 anni
1.016
-9.419
-90.26%
Classificazione dei paesi secondo i statistiche attuali per anni


Commenti: