29
/it/
it
AIzaSyAYiBZKx7MnpbEhh9jyipgxe19OcubqV5w
April 1, 2024
136750
Gambia, The
GMB
true
2
1
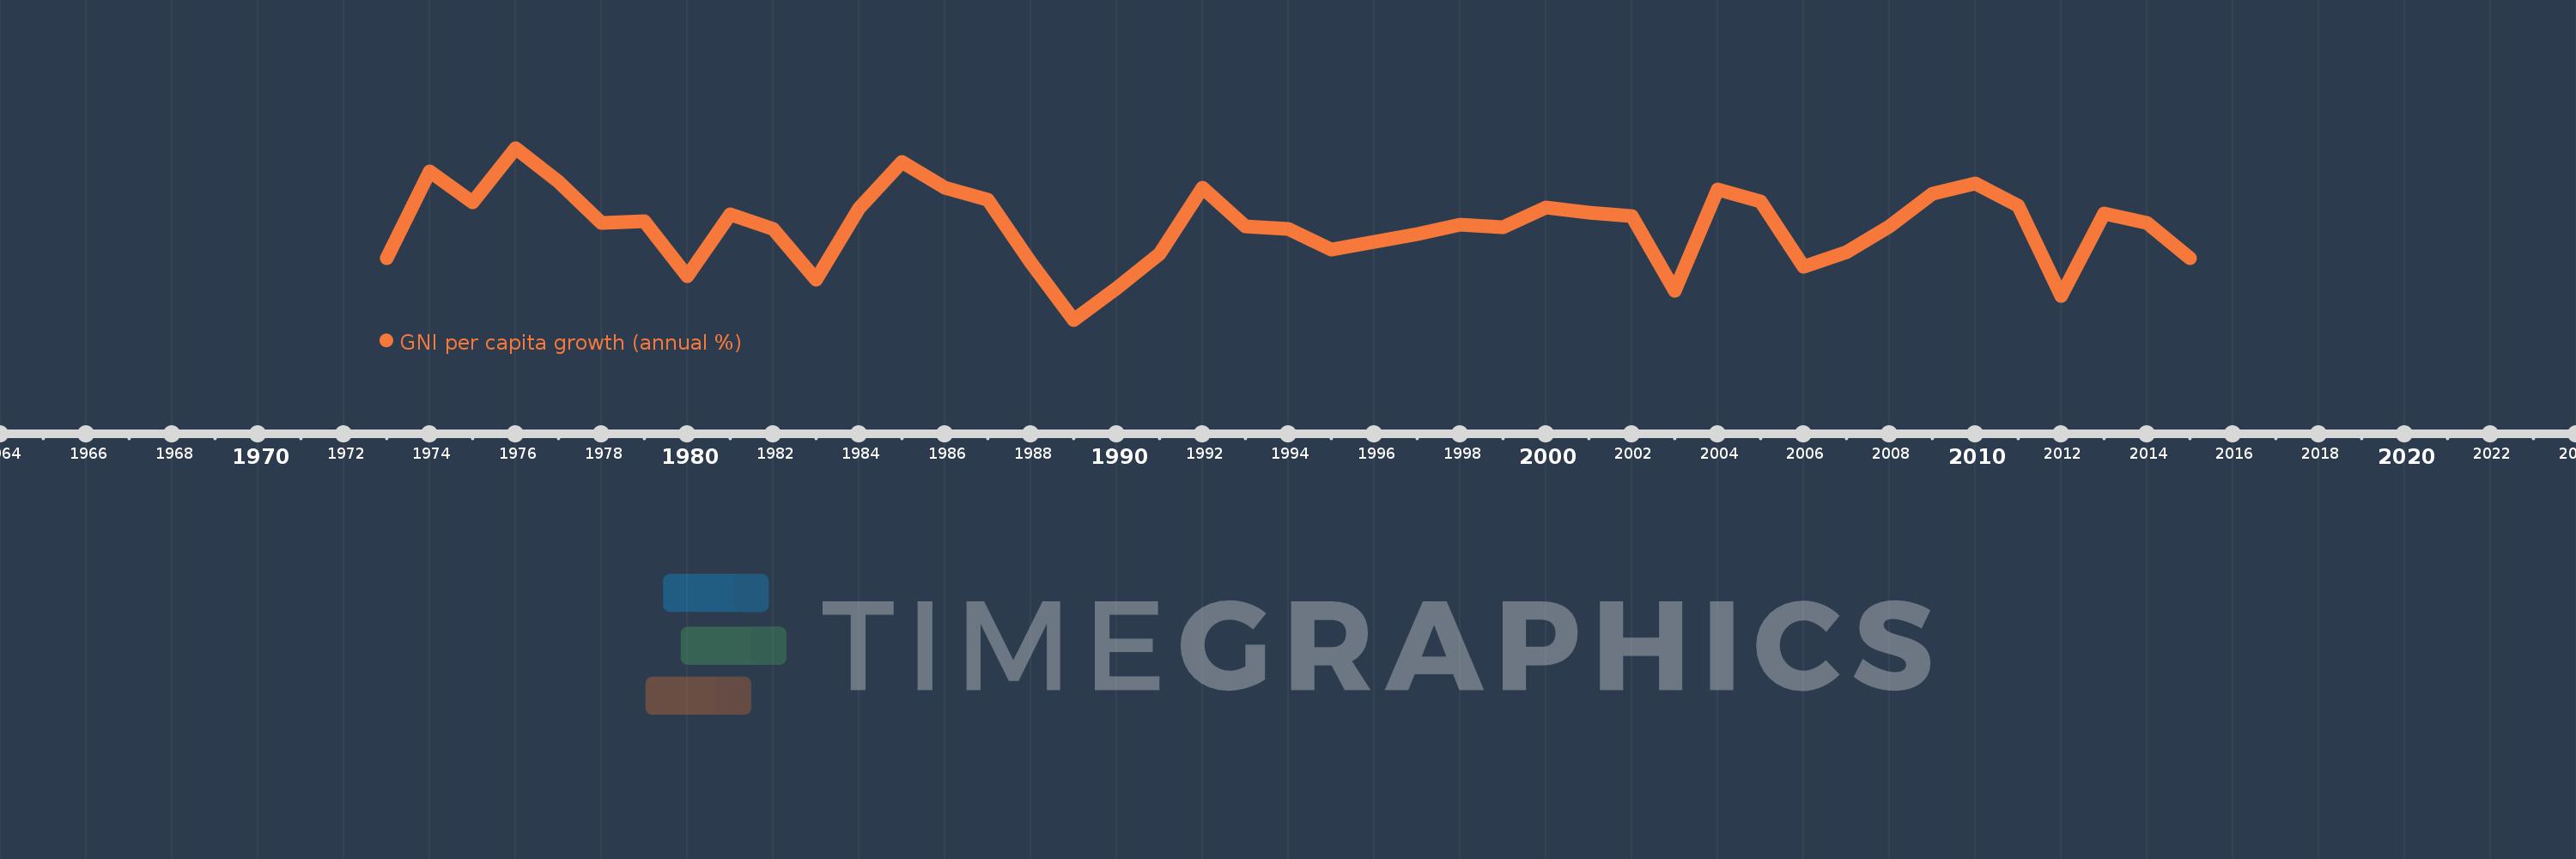
GNI per capita growth (annual %)
2015,2014,2013,2012,2011,2010,2009,2008,2007,2006,2005,2004,2003,2002,2001,2000,1999,1998,1997,1996,1995,1994,1993,1992,1991,1990,1989,1988,1987,1986,1985,1984,1983,1982,1981,1980,1979,1978,1977,1976,1975,1974,1973
Queste statistiche in altri paesi:
AlbaniaAlgeriaAngolaAntigua and BarbudaArab WorldArgentinaArmeniaAustraliaAustriaAzerbaijanBahamas, TheBahrainBangladeshBarbadosBelarusBelgiumBelizeBeninBhutanBoliviaBosnia and HerzegovinaBotswanaBrazilBrunei DarussalamBulgariaBurkina FasoBurundiCabo VerdeCambodiaCameroonCanadaCaribbean small statesCentral Europe and the BalticsChadChileChinaColombiaComorosCongo, Dem. Rep.Congo, Rep.Costa RicaCote d'IvoireCroatiaCubaCyprusCzech RepublicDenmarkDjiboutiDominican RepublicEarly-demographic dividendEast Asia & PacificEast Asia & Pacific (excluding high income)East Asia & Pacific (IDA & IBRD countries)EcuadorEgypt, Arab Rep.El SalvadorEquatorial GuineaEritreaEstoniaEthiopiaEuro areaEurope & Central AsiaEurope & Central Asia (excluding high income)Europe & Central Asia (IDA & IBRD countries)European UnionFijiFinlandFranceGabonGambia, TheGeorgiaGermanyGhanaGreeceGuatemalaGuineaGuinea-BissauHaitiHeavily indebted poor countries (HIPC)High incomeHondurasHong Kong SAR, ChinaHungaryIBRD onlyIcelandIDA & IBRD totalIDA blendIDA onlyIDA totalIndiaIndonesiaIran, Islamic Rep.IrelandIsraelItalyJamaicaJapanJordanKazakhstanKenyaKorea, Rep.KosovoKuwaitKyrgyz RepublicLao PDRLate-demographic dividendLatin America & Caribbean Latin America & Caribbean (excluding high income)Latin America & the Caribbean (IDA & IBRD countries)LatviaLeast developed countries: UN classificationLebanonLiberiaLibyaLithuaniaLow & middle incomeLow incomeLower middle incomeLuxembourgMacao SAR, ChinaMacedonia, FYRMadagascarMalawiMalaysiaMaliMaltaMauritaniaMauritiusMexicoMiddle East & North AfricaMiddle East & North Africa (excluding high income)Middle East & North Africa (IDA & IBRD countries)Middle incomeMoldovaMongoliaMontenegroMoroccoMozambiqueMyanmarNamibiaNepalNetherlandsNew ZealandNicaraguaNigerNigeriaNorth AmericaNorwayOECD membersOmanOther small statesPakistanPanamaPapua New GuineaParaguayPeruPhilippinesPolandPortugalPost-demographic dividendPre-demographic dividendPuerto RicoQatarRomaniaRussian FederationRwandaSamoaSaudi ArabiaSenegalSerbiaSeychellesSierra LeoneSingaporeSlovak RepublicSloveniaSmall statesSomaliaSouth AfricaSouth AsiaSouth Asia (IDA & IBRD)South SudanSpainSri LankaSub-Saharan Africa Sub-Saharan Africa (excluding high income)Sub-Saharan Africa (IDA & IBRD countries)SudanSurinameSwazilandSwedenSwitzerlandSyrian Arab RepublicTajikistanTanzaniaThailandTimor-LesteTogoTrinidad and TobagoTunisiaTurkeyTurkmenistanUgandaUkraineUnited Arab EmiratesUnited KingdomUnited StatesUpper middle incomeUruguayUzbekistanVanuatuVenezuela, RBVietnamWest Bank and GazaWorldZambiaZimbabwe Linea del tempo:
Questa scala temporale mostra un grafico dal 1973 anno al 2015 anno. Gambia, The. I dati fino ad 1972 anno non disponibili. Il numero di osservazioni attuali secondo i date: 43.
La fonte (nome):
Indicatori dello sviluppo mondiale
La fonte (organizzazione):
World Bank national accounts data, and OECD National Accounts data files.
Categorie:
Economy & Growth
sono stati aggiornati
23 apr 2017 anni
Indicatori delle variazioni dei valori per anni
Minima:
-11.239
1 gen 1989 anni
Massimo:
10.422
1 gen 1976 anni
Alla data di osservazione
Valore
Variazione assoluta
La variazione rispetto al valore precedente
1 gen 1973 anni
-3.475
-3.475
0.0%
1 gen 1974 anni
7.475
+10.95
-315.09%
1 gen 1975 anni
3.573
-3.902
-52.2%
1 gen 1976 anni
10.422
+6.85
191.72%
1 gen 1977 anni
6.115
-4.307
-41.33%
1 gen 1978 anni
0.928
-5.187
-84.83%
1 gen 1979 anni
1.208
+0.28
30.17%
1 gen 1980 anni
-5.785
-6.993
-578.97%
1 gen 1981 anni
2.09
+7.875
-136.13%
1 gen 1982 anni
0.193
-1.897
-90.75%
1 gen 1983 anni
-6.146
-6.339
-3.28 Mille.%
1 gen 1984 anni
2.799
+8.945
-145.54%
1 gen 1985 anni
8.687
+5.889
210.39%
1 gen 1986 anni
5.43
-3.257
-37.49%
1 gen 1987 anni
3.857
-1.573
-28.97%
1 gen 1988 anni
-4.005
-7.862
-203.82%
1 gen 1989 anni
-11.239
-7.234
180.64%
1 gen 1990 anni
-7.241
+3.999
-35.58%
1 gen 1991 anni
-2.955
+4.286
-59.2%
1 gen 1992 anni
5.461
+8.415
-284.83%
1 gen 1993 anni
0.565
-4.896
-89.65%
1 gen 1994 anni
0.186
-0.379
-67.13%
1 gen 1995 anni
-2.398
-2.584
-1.39 Mille.%
1 gen 1996 anni
-1.428
+0.97
-40.46%
1 gen 1997 anni
-0.453
+0.975
-68.26%
1 gen 1998 anni
0.708
+1.161
-256.2%
1 gen 1999 anni
0.401
-0.307
-43.37%
1 gen 2000 anni
2.924
+2.523
629.33%
1 gen 2001 anni
2.253
-0.671
-22.94%
1 gen 2002 anni
1.883
-0.369
-16.4%
1 gen 2003 anni
-7.595
-9.479
-503.27%
1 gen 2004 anni
5.207
+12.802
-168.55%
1 gen 2005 anni
3.687
-1.519
-29.18%
1 gen 2006 anni
-4.553
-8.24
-223.47%
1 gen 2007 anni
-2.757
+1.796
-39.45%
1 gen 2008 anni
0.545
+3.302
-119.78%
1 gen 2009 anni
4.604
+4.058
744.28%
1 gen 2010 anni
5.916
+1.312
28.51%
1 gen 2011 anni
3.179
-2.737
-46.26%
1 gen 2012 anni
-8.236
-11.415
-359.03%
1 gen 2013 anni
2.152
+10.387
-126.13%
1 gen 2014 anni
0.974
-1.178
-54.74%
1 gen 2015 anni
-3.515
-4.489
-460.97%
Classificazione dei paesi secondo i statistiche attuali per anni


Commenti: