29
/it/
it
AIzaSyAYiBZKx7MnpbEhh9jyipgxe19OcubqV5w
April 1, 2024
262630
Thailand
THA
true
2
1
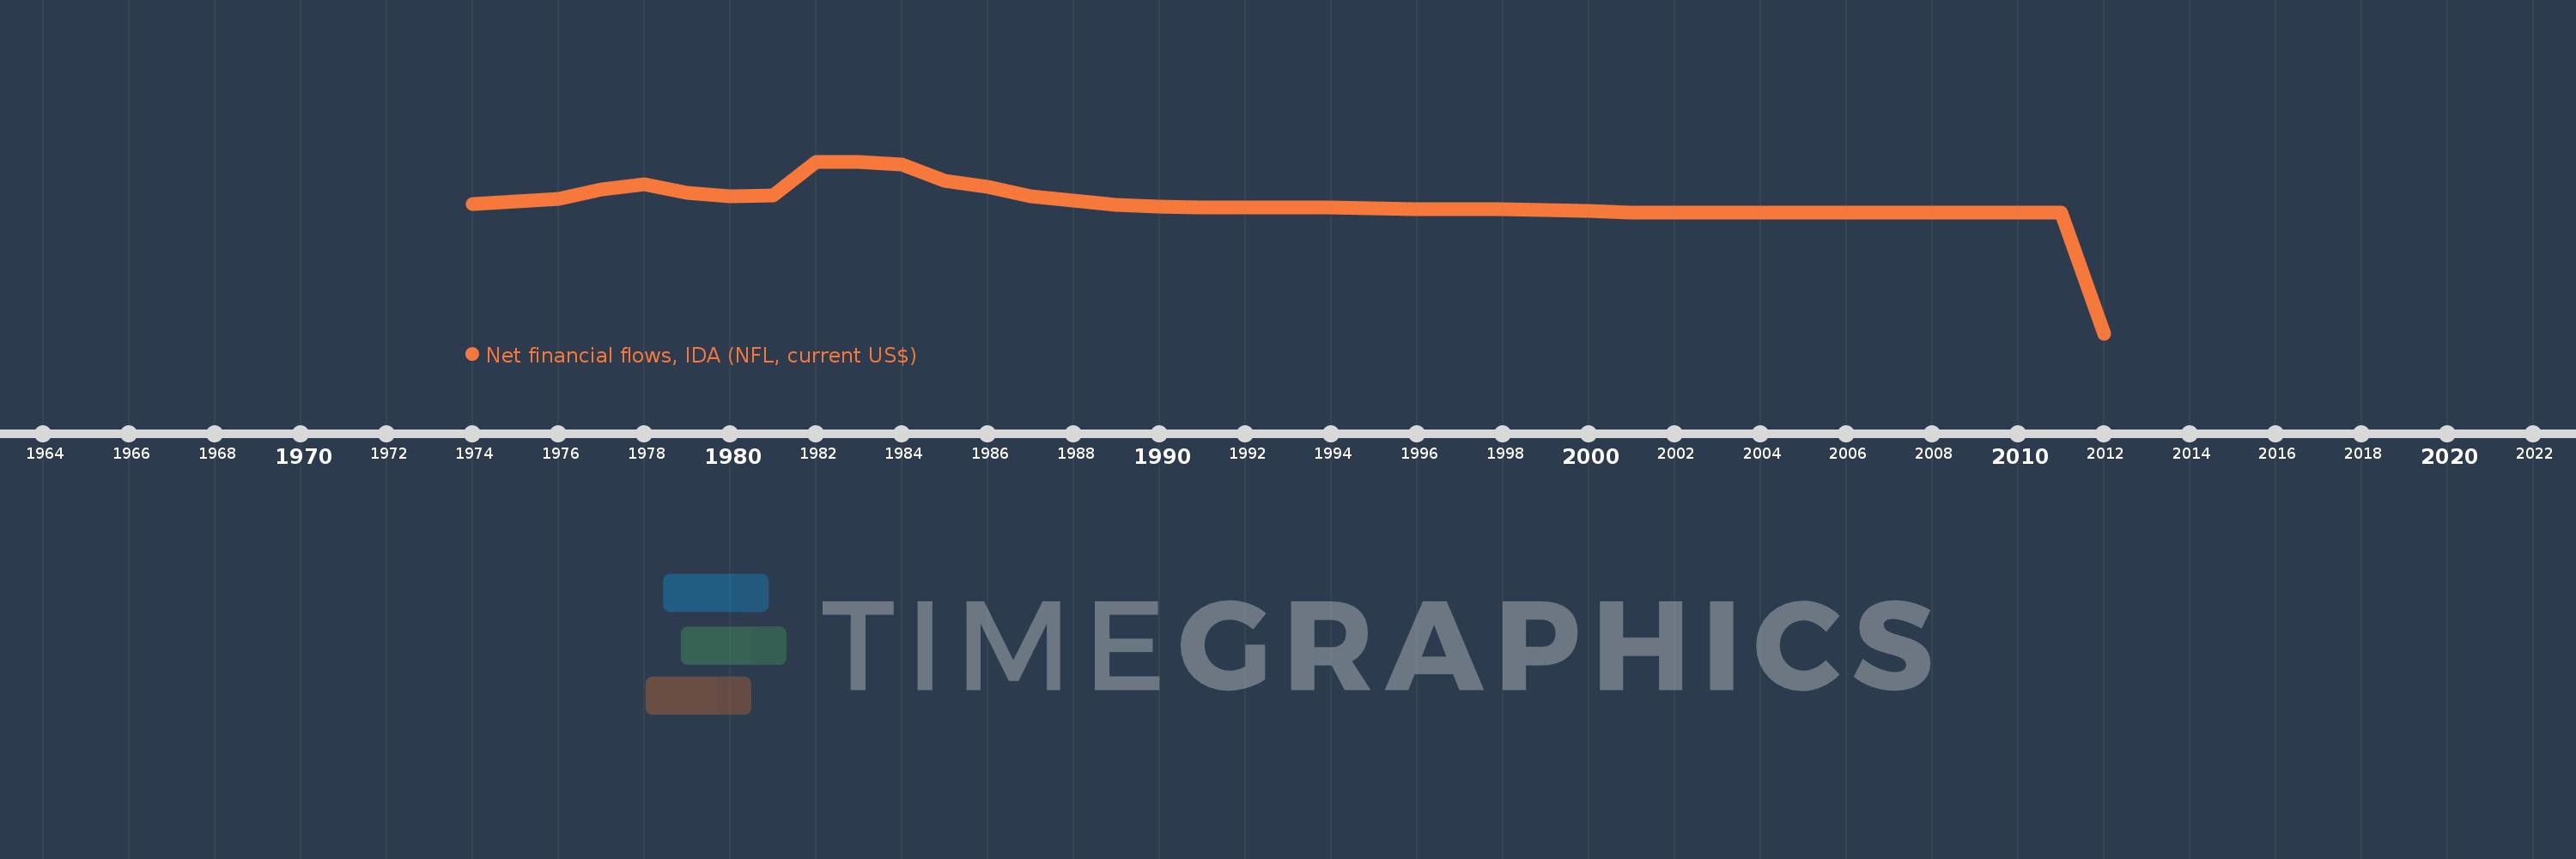
Net financial flows, IDA (NFL, current US$)
2012,2011,2010,2009,2008,2007,2006,2005,2004,2003,2002,2001,2000,1999,1998,1997,1996,1995,1994,1993,1992,1991,1990,1989,1988,1987,1986,1985,1984,1983,1982,1981,1980,1979,1978,1977,1976,1975,1974
Queste statistiche in altri paesi:
Linea del tempo:
Questa scala temporale mostra un grafico dal 1974 anno al 2012 anno. Thailand. I dati fino ad 1973 anno non disponibili. Il numero di osservazioni attuali secondo i date: 39.
La fonte (nome):
Indicatori dello sviluppo mondiale
La fonte (organizzazione):
World Bank, International Debt Statistics.
Categorie:
External Debt
sono stati aggiornati
23 apr 2017 anni
Indicatori delle variazioni dei valori per anni
Minima:
-55.735 Mln
1 gen 2012 anni
Massimo:
18.717 Mln
1 gen 1982 anni
Alla data di osservazione
Valore
Variazione assoluta
La variazione rispetto al valore precedente
1 gen 1974 anni
172.0 Mille.
+172.0 Mille.
0.0%
1 gen 1975 anni
1.263 Mln
+1.091 Mln
634.3%
1 gen 1976 anni
2.687 Mln
+1.424 Mln
112.75%
1 gen 1977 anni
6.527 Mln
+3.84 Mln
142.91%
1 gen 1978 anni
8.756 Mln
+2.229 Mln
34.15%
1 gen 1979 anni
5.106 Mln
-3.65 Mln
-41.69%
1 gen 1980 anni
3.542 Mln
-1.564 Mln
-30.63%
1 gen 1981 anni
4.139 Mln
+597.0 Mille.
16.85%
1 gen 1982 anni
18.717 Mln
+14.578 Mln
352.21%
1 gen 1983 anni
18.542 Mln
-175.0 Mille.
-0.93%
1 gen 1984 anni
17.349 Mln
-1.193 Mln
-6.43%
1 gen 1985 anni
10.512 Mln
-6.837 Mln
-39.41%
1 gen 1986 anni
7.874 Mln
-2.638 Mln
-25.1%
1 gen 1987 anni
3.697 Mln
-4.177 Mln
-53.05%
1 gen 1988 anni
1.637 Mln
-2.06 Mln
-55.72%
1 gen 1989 anni
35.0 Mille.
-1.602 Mln
-97.86%
1 gen 1990 anni
-773.0 Mille.
-808.0 Mille.
-2.31 Mille.%
1 gen 1991 anni
-1.157 Mln
-384.0 Mille.
49.68%
1 gen 1992 anni
-1.126 Mln
+31.0 Mille.
-2.68%
1 gen 1993 anni
-1.126 Mln
0.0
0.0%
1 gen 1994 anni
-1.374 Mln
-248.0 Mille.
22.02%
1 gen 1995 anni
-1.692 Mln
-318.0 Mille.
23.14%
1 gen 1996 anni
-1.761 Mln
-69.0 Mille.
4.08%
1 gen 1997 anni
-1.761 Mln
0.0
0.0%
1 gen 1998 anni
-1.761 Mln
0.0
0.0%
1 gen 1999 anni
-2.307 Mln
-546.0 Mille.
31.01%
1 gen 2000 anni
-2.841 Mln
-534.0 Mille.
23.15%
1 gen 2001 anni
-3.377 Mln
-536.0 Mille.
18.87%
1 gen 2002 anni
-3.377 Mln
0.0
0.0%
1 gen 2003 anni
-3.377 Mln
0.0
0.0%
1 gen 2004 anni
-3.377 Mln
0.0
0.0%
1 gen 2005 anni
-3.377 Mln
0.0
0.0%
1 gen 2006 anni
-3.377 Mln
0.0
0.0%
1 gen 2007 anni
-3.377 Mln
0.0
0.0%
1 gen 2008 anni
-3.377 Mln
0.0
0.0%
1 gen 2009 anni
-3.377 Mln
0.0
0.0%
1 gen 2010 anni
-3.377 Mln
0.0
0.0%
1 gen 2011 anni
-3.377 Mln
0.0
0.0%
1 gen 2012 anni
-55.735 Mln
-52.358 Mln
1.55 Mille.%
Classificazione dei paesi secondo i statistiche attuali per anni


Commenti: