30
/it/
AIzaSyAYiBZKx7MnpbEhh9jyipgxe19OcubqV5w
April 1, 2024
128601
Eritrea
ERI
true
2
1
Net financial flows, IDA (NFL, current US$)
2016,2015,2014,2012,2011,2010,2009,2008,2007,2006,2005,2004,2003,2002,2001,2000,1999,1998,1997,1996,1995
Download
Biblioteca di statistiche globali →Eritrea →

Net financial flows, IDA (NFL, current US$)

Queste statistiche in altri paesi:

AfghanistanAlbaniaAngolaArmeniaAzerbaijanBangladeshBeninBhutanBoliviaBosnia and HerzegovinaBotswanaBurkina FasoBurundiCabo VerdeCambodiaCameroonCaribbean small statesCentral African RepublicCentral Europe and the BalticsChadChinaColombiaComorosCongo, Dem. Rep.Congo, Rep.Costa RicaCote d'IvoireCroatiaCzech RepublicDjiboutiDominicaDominican RepublicEarly-demographic dividendEast Asia & PacificEast Asia & Pacific (excluding high income)East Asia & Pacific (IDA & IBRD countries)EcuadorEgypt, Arab Rep.El SalvadorEquatorial GuineaEritreaEstoniaEthiopiaEurope & Central AsiaEurope & Central Asia (excluding high income)Europe & Central Asia (IDA & IBRD countries)Fragile and conflict affected situationsGambia, TheGeorgiaGhanaGreeceGrenadaGuineaGuinea-BissauGuyanaHaitiHondurasHungaryIBRD onlyIDA & IBRD totalIDA blendIDA onlyIDA totalIndiaIndonesiaJordanKenyaKorea, Rep.KosovoKyrgyz RepublicLao PDRLate-demographic dividendLatin America & Caribbean Latin America & Caribbean (excluding high income)Latin America & the Caribbean (IDA & IBRD countries)LesothoLiberiaLow & middle incomeLow incomeLower middle incomeMacedonia, FYRMadagascarMalawiMaldivesMaliMauritaniaMauritiusMiddle East & North AfricaMiddle East & North Africa (excluding high income)Middle East & North Africa (IDA & IBRD countries)Middle incomeMoldovaMongoliaMontenegroMoroccoMozambiqueMyanmarNepalNicaraguaNigerNigeriaOmanOther small statesPacific island small statesPakistanPapua New GuineaParaguayPhilippinesPolandPre-demographic dividendRwandaSamoaSao Tome and PrincipeSenegalSerbiaSeychellesSierra LeoneSlovak RepublicSloveniaSmall statesSolomon IslandsSomaliaSouth AsiaSouth Asia (IDA & IBRD)Sri LankaSt. Kitts and NevisSt. LuciaSt. Vincent and the GrenadinesSub-Saharan Africa Sub-Saharan Africa (excluding high income)Sub-Saharan Africa (IDA & IBRD countries)SudanSwazilandSyrian Arab RepublicTajikistanTanzaniaThailandTogoTongaTrinidad and TobagoTunisiaTurkeyUgandaUpper middle incomeUzbekistanVanuatuVietnamYemen, Rep.ZambiaZimbabwe

Linea del tempo:

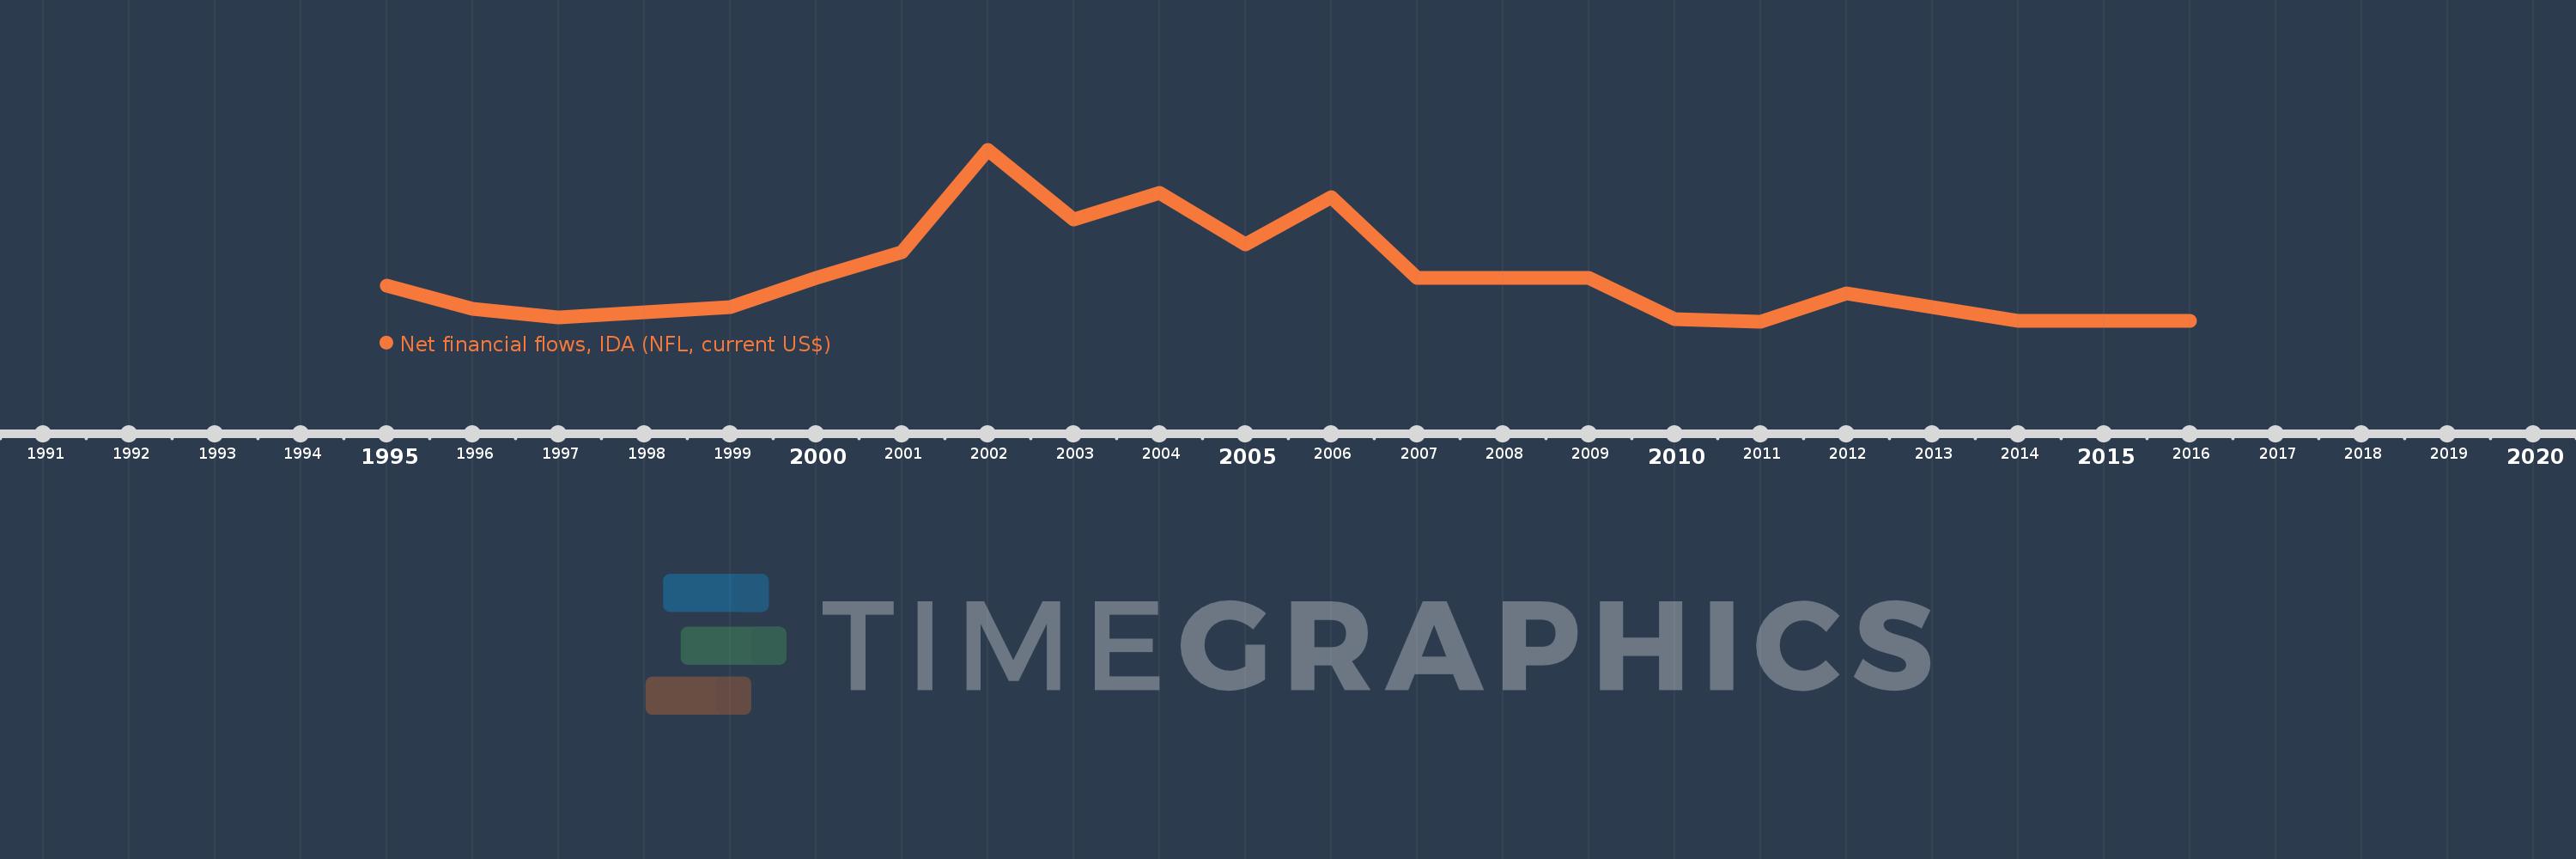
Questa scala temporale mostra un grafico dal 1995 anno al 2016 anno. Eritrea. I dati fino ad 1994 anno non disponibili. Il numero di osservazioni attuali secondo i date: 21.

La fonte (nome):

Indicatori dello sviluppo mondiale

La fonte (organizzazione):

World Bank, International Debt Statistics.

Categorie:

External Debt

sono stati aggiornati

23 apr 2017 anni

Indicatori delle variazioni dei valori per anni

In media:
20.473 Mln
Minima:
-513.0 Mille.
1 gen 2011 anni
Massimo:
78.15 Mln
1 gen 2002 anni
Alla data di osservazione
Valore
Variazione assoluta
La variazione rispetto al valore precedente
1 gen 1995 anni
16.014 Mln
+16.014 Mln
0.0%
1 gen 1996 anni
5.379 Mln
-10.635 Mln
-66.41%
1 gen 1997 anni
1.497 Mln
-3.882 Mln
-72.17%
1 gen 1998 anni
3.759 Mln
+2.262 Mln
151.1%
1 gen 1999 anni
6.28 Mln
+2.521 Mln
67.07%
1 gen 2000 anni
19.507 Mln
+13.227 Mln
210.62%
1 gen 2001 anni
31.62 Mln
+12.113 Mln
62.1%
1 gen 2002 anni
78.15 Mln
+46.53 Mln
147.15%
1 gen 2003 anni
46.216 Mln
-31.934 Mln
-40.86%
1 gen 2004 anni
58.463 Mln
+12.247 Mln
26.5%
1 gen 2005 anni
35.098 Mln
-23.365 Mln
-39.97%
1 gen 2006 anni
56.746 Mln
+21.648 Mln
61.68%
1 gen 2007 anni
19.471 Mln
-37.275 Mln
-65.69%
1 gen 2008 anni
19.554 Mln
+83.0 Mille.
0.43%
1 gen 2009 anni
19.494 Mln
-60.0 Mille.
-0.31%
1 gen 2010 anni
764.0 Mille.
-18.73 Mln
-96.08%
1 gen 2011 anni
-513.0 Mille.
-1.277 Mln
-167.15%
1 gen 2012 anni
12.427 Mln
+12.94 Mln
-2.52 Mille.%
1 gen 2014 anni
0.0
-12.427 Mln
-100.0%
1 gen 2015 anni
0.0
0.0
%
1 gen 2016 anni
0.0
0.0
%

Classificazione dei paesi secondo i statistiche attuali per anni