29
/it/
it
AIzaSyAYiBZKx7MnpbEhh9jyipgxe19OcubqV5w
April 1, 2024
149464
Haiti
HTI
true
2
1
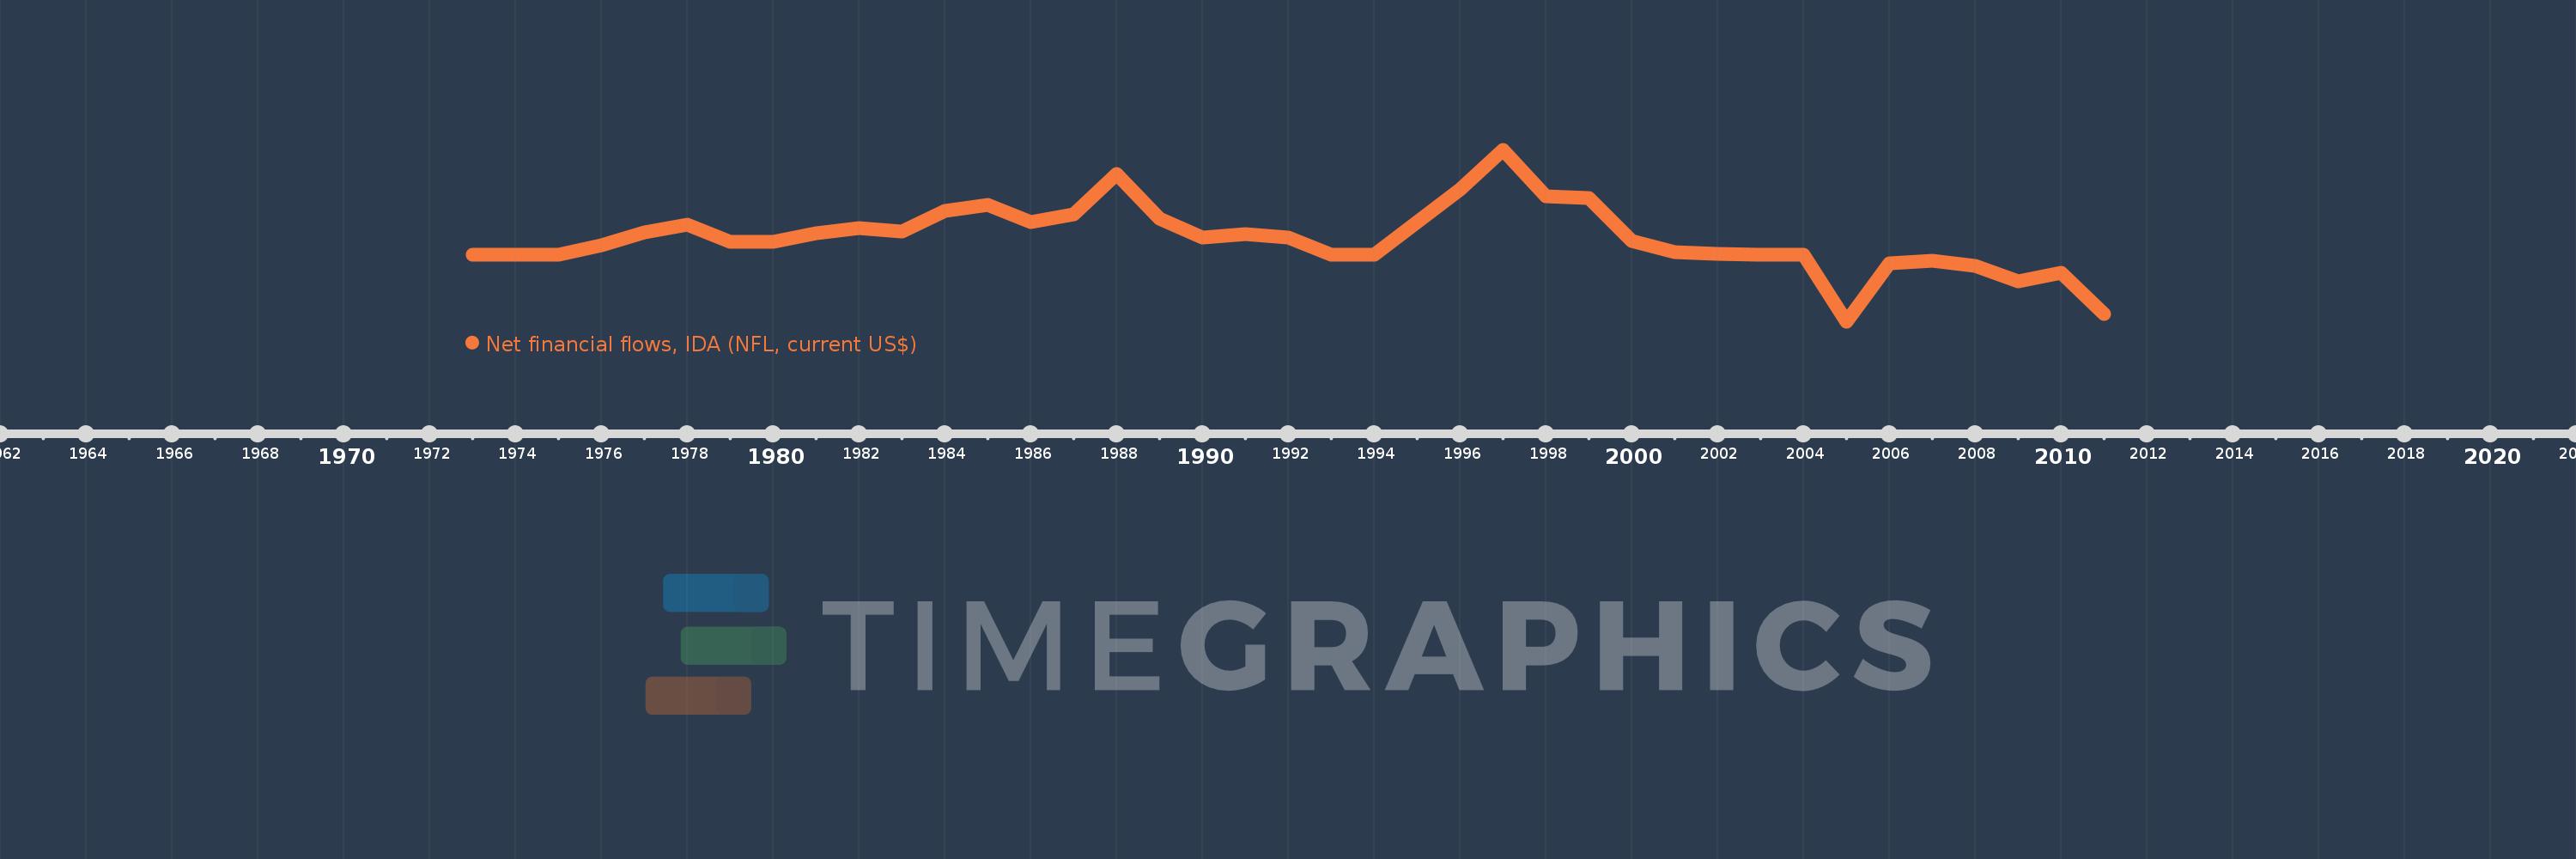
Net financial flows, IDA (NFL, current US$)
2011,2010,2009,2008,2007,2006,2005,2004,2003,2002,2001,2000,1999,1998,1997,1996,1994,1993,1992,1991,1990,1989,1988,1987,1986,1985,1984,1983,1982,1981,1980,1979,1978,1977,1976,1975,1974,1973
Queste statistiche in altri paesi:
Linea del tempo:
Questa scala temporale mostra un grafico dal 1973 anno al 2011 anno. Haiti. I dati fino ad 1972 anno non disponibili. Il numero di osservazioni attuali secondo i date: 38.
La fonte (nome):
Indicatori dello sviluppo mondiale
La fonte (organizzazione):
World Bank, International Debt Statistics.
Categorie:
External Debt
sono stati aggiornati
23 apr 2017 anni
Indicatori delle variazioni dei valori per anni
Minima:
-40.499 Mln
1 gen 2005 anni
Massimo:
62.868 Mln
1 gen 1997 anni
Alla data di osservazione
Valore
Variazione assoluta
La variazione rispetto al valore precedente
1 gen 1973 anni
-2.0 Mille.
-2.0 Mille.
0.0%
1 gen 1974 anni
-4.0 Mille.
-2.0 Mille.
100.0%
1 gen 1975 anni
-4.0 Mille.
0.0
0.0%
1 gen 1976 anni
5.844 Mln
+5.848 Mln
-146.2 Mille.%
1 gen 1977 anni
13.166 Mln
+7.322 Mln
125.29%
1 gen 1978 anni
17.919 Mln
+4.753 Mln
36.1%
1 gen 1979 anni
7.915 Mln
-10.004 Mln
-55.83%
1 gen 1980 anni
7.943 Mln
+28.0 Mille.
0.35%
1 gen 1981 anni
13.092 Mln
+5.149 Mln
64.82%
1 gen 1982 anni
16.181 Mln
+3.089 Mln
23.59%
1 gen 1983 anni
13.953 Mln
-2.228 Mln
-13.77%
1 gen 1984 anni
26.316 Mln
+12.363 Mln
88.6%
1 gen 1985 anni
30.161 Mln
+3.845 Mln
14.61%
1 gen 1986 anni
19.778 Mln
-10.383 Mln
-34.43%
1 gen 1987 anni
24.483 Mln
+4.705 Mln
23.79%
1 gen 1988 anni
48.356 Mln
+23.873 Mln
97.51%
1 gen 1989 anni
21.582 Mln
-26.774 Mln
-55.37%
1 gen 1990 anni
10.153 Mln
-11.429 Mln
-52.96%
1 gen 1991 anni
12.56 Mln
+2.407 Mln
23.71%
1 gen 1992 anni
10.178 Mln
-2.382 Mln
-18.96%
1 gen 1993 anni
7.0 Mille.
-10.171 Mln
-99.93%
1 gen 1994 anni
-5.0 Mille.
-12.0 Mille.
-171.43%
1 gen 1996 anni
39.345 Mln
+39.35 Mln
-787.0 Mille.%
1 gen 1997 anni
62.868 Mln
+23.523 Mln
59.79%
1 gen 1998 anni
35.108 Mln
-27.76 Mln
-44.16%
1 gen 1999 anni
33.964 Mln
-1.144 Mln
-3.26%
1 gen 2000 anni
8.236 Mln
-25.728 Mln
-75.75%
1 gen 2001 anni
1.482 Mln
-6.754 Mln
-82.01%
1 gen 2002 anni
744.0 Mille.
-738.0 Mille.
-49.8%
1 gen 2003 anni
-124.0 Mille.
-868.0 Mille.
-116.67%
1 gen 2004 anni
0.0
+124.0 Mille.
-100.0%
1 gen 2005 anni
-40.499 Mln
-40.499 Mln
%
1 gen 2006 anni
-5.139 Mln
+35.36 Mln
-87.31%
1 gen 2007 anni
-3.907 Mln
+1.232 Mln
-23.97%
1 gen 2008 anni
-6.66 Mln
-2.753 Mln
70.46%
1 gen 2009 anni
-15.823 Mln
-9.163 Mln
137.58%
1 gen 2010 anni
-10.972 Mln
+4.851 Mln
-30.66%
1 gen 2011 anni
-35.942 Mln
-24.97 Mln
227.58%
Classificazione dei paesi secondo i statistiche attuali per anni


Commenti: