29
/it/
it
AIzaSyAYiBZKx7MnpbEhh9jyipgxe19OcubqV5w
April 1, 2024
254134
Suriname
SUR
true
2
1
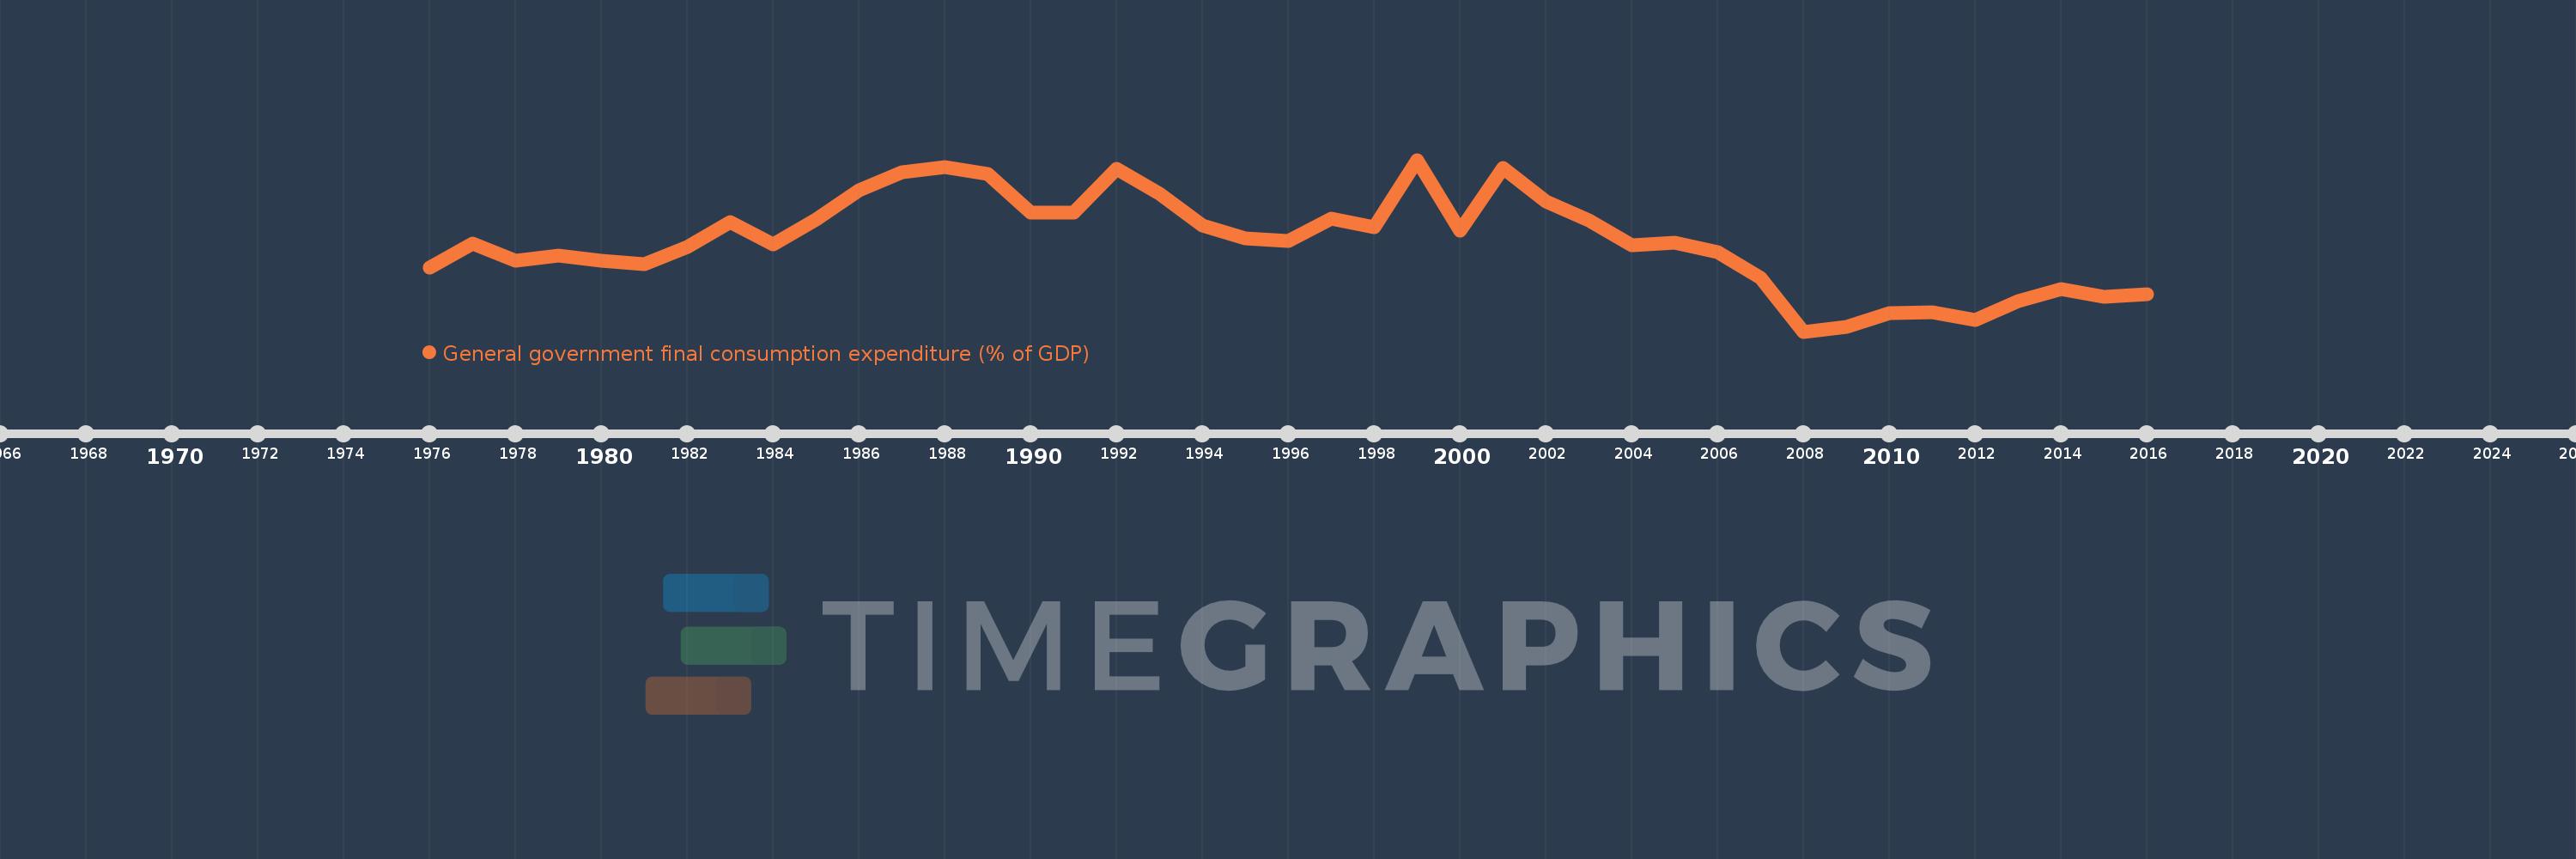
General government final consumption expenditure (% of GDP)
2016,2015,2014,2013,2012,2011,2010,2009,2008,2007,2006,2005,2004,2003,2002,2001,2000,1999,1998,1997,1996,1995,1994,1993,1992,1991,1990,1989,1988,1987,1986,1985,1984,1983,1982,1981,1980,1979,1978,1977,1976
Queste statistiche in altri paesi:
AfghanistanAlbaniaAlgeriaAngolaAntigua and BarbudaArab WorldArgentinaArmeniaArubaAustraliaAustriaAzerbaijanBahamas, TheBahrainBangladeshBarbadosBelarusBelgiumBelizeBeninBermudaBhutanBoliviaBosnia and HerzegovinaBotswanaBrazilBrunei DarussalamBulgariaBurkina FasoBurundiCabo VerdeCambodiaCameroonCanadaCaribbean small statesCentral African RepublicCentral Europe and the BalticsChadChileChinaColombiaComorosCongo, Dem. Rep.Congo, Rep.Costa RicaCote d'IvoireCroatiaCubaCyprusCzech RepublicDenmarkDjiboutiDominicaDominican RepublicEarly-demographic dividendEast Asia & PacificEast Asia & Pacific (excluding high income)East Asia & Pacific (IDA & IBRD countries)EcuadorEgypt, Arab Rep.El SalvadorEquatorial GuineaEritreaEstoniaEthiopiaEuro areaEurope & Central AsiaEurope & Central Asia (excluding high income)Europe & Central Asia (IDA & IBRD countries)European UnionFaroe IslandsFijiFinlandFragile and conflict affected situationsFranceFrench PolynesiaGabonGambia, TheGeorgiaGermanyGhanaGreeceGrenadaGuatemalaGuineaGuinea-BissauGuyanaHaitiHeavily indebted poor countries (HIPC)High incomeHondurasHong Kong SAR, ChinaHungaryIBRD onlyIcelandIDA & IBRD totalIDA blendIDA onlyIDA totalIndiaIndonesiaIran, Islamic Rep.IraqIrelandIsraelItalyJamaicaJapanJordanKazakhstanKenyaKiribatiKorea, Rep.KosovoKuwaitKyrgyz RepublicLao PDRLate-demographic dividendLatin America & Caribbean Latin America & Caribbean (excluding high income)Latin America & the Caribbean (IDA & IBRD countries)LatviaLeast developed countries: UN classificationLebanonLesothoLiberiaLibyaLithuaniaLow & middle incomeLow incomeLower middle incomeLuxembourgMacao SAR, ChinaMacedonia, FYRMadagascarMalawiMalaysiaMaldivesMaliMaltaMauritaniaMauritiusMexicoMicronesia, Fed. Sts.Middle East & North AfricaMiddle East & North Africa (excluding high income)Middle East & North Africa (IDA & IBRD countries)Middle incomeMoldovaMongoliaMontenegroMoroccoMozambiqueNamibiaNepalNetherlandsNew CaledoniaNew ZealandNicaraguaNigerNigeriaNorth AmericaNorwayOECD membersOmanOther small statesPacific island small statesPakistanPanamaPapua New GuineaParaguayPeruPhilippinesPolandPortugalPost-demographic dividendPre-demographic dividendPuerto RicoQatarRomaniaRussian FederationRwandaSaudi ArabiaSenegalSerbiaSeychellesSierra LeoneSingaporeSlovak RepublicSloveniaSmall statesSolomon IslandsSomaliaSouth AfricaSouth AsiaSouth Asia (IDA & IBRD)South SudanSpainSri LankaSt. Kitts and NevisSt. LuciaSt. Vincent and the GrenadinesSub-Saharan Africa Sub-Saharan Africa (excluding high income)Sub-Saharan Africa (IDA & IBRD countries)SudanSurinameSwazilandSwedenSwitzerlandSyrian Arab RepublicTajikistanTanzaniaThailandTimor-LesteTogoTongaTrinidad and TobagoTunisiaTurkeyTurkmenistanUgandaUkraineUnited Arab EmiratesUnited KingdomUnited StatesUpper middle incomeUruguayUzbekistanVanuatuVenezuela, RBVietnamWest Bank and GazaWorldYemen, Rep.ZambiaZimbabwe Linea del tempo:
Questa scala temporale mostra un grafico dal 1976 anno al 2016 anno. Suriname. I dati fino ad 1975 anno non disponibili. Il numero di osservazioni attuali secondo i date: 41.
La fonte (nome):
Indicatori dello sviluppo mondiale
La fonte (organizzazione):
World Bank national accounts data, and OECD National Accounts data files.
Categorie:
Economy & Growth
sono stati aggiornati
23 apr 2017 anni
Indicatori delle variazioni dei valori per anni
Minima:
10.123
1 gen 2008 anni
Massimo:
38.836
1 gen 1999 anni
Alla data di osservazione
Valore
Variazione assoluta
La variazione rispetto al valore precedente
1 gen 1976 anni
20.753
+20.753
0.0%
1 gen 1977 anni
24.827
+4.074
19.63%
1 gen 1978 anni
21.997
-2.83
-11.4%
1 gen 1979 anni
22.774
+0.777
3.53%
1 gen 1980 anni
21.903
-0.871
-3.82%
1 gen 1981 anni
21.323
-0.58
-2.65%
1 gen 1982 anni
24.239
+2.916
13.67%
1 gen 1983 anni
28.411
+4.171
17.21%
1 gen 1984 anni
24.74
-3.671
-12.92%
1 gen 1985 anni
28.861
+4.121
16.66%
1 gen 1986 anni
33.696
+4.835
16.75%
1 gen 1987 anni
36.801
+3.105
9.22%
1 gen 1988 anni
37.582
+0.781
2.12%
1 gen 1989 anni
36.536
-1.046
-2.78%
1 gen 1990 anni
30.034
-6.502
-17.8%
1 gen 1991 anni
30.008
-0.026
-0.09%
1 gen 1992 anni
37.314
+7.307
24.35%
1 gen 1993 anni
33.22
-4.095
-10.97%
1 gen 1994 anni
27.813
-5.406
-16.27%
1 gen 1995 anni
25.647
-2.166
-7.79%
1 gen 1996 anni
25.307
-0.34
-1.33%
1 gen 1997 anni
28.983
+3.677
14.53%
1 gen 1998 anni
27.574
-1.41
-4.86%
1 gen 1999 anni
38.836
+11.262
40.84%
1 gen 2000 anni
26.953
-11.883
-30.6%
1 gen 2001 anni
37.494
+10.541
39.11%
1 gen 2002 anni
31.879
-5.616
-14.98%
1 gen 2003 anni
28.784
-3.095
-9.71%
1 gen 2004 anni
24.619
-4.164
-14.47%
1 gen 2005 anni
25.02
+0.401
1.63%
1 gen 2006 anni
23.343
-1.678
-6.71%
1 gen 2007 anni
19.128
-4.214
-18.05%
1 gen 2008 anni
10.123
-9.005
-47.08%
1 gen 2009 anni
10.899
+0.776
7.67%
1 gen 2010 anni
13.179
+2.28
20.92%
1 gen 2011 anni
13.324
+0.145
1.1%
1 gen 2012 anni
12.068
-1.257
-9.43%
1 gen 2013 anni
15.249
+3.181
26.36%
1 gen 2014 anni
17.222
+1.973
12.94%
1 gen 2015 anni
15.965
-1.257
-7.3%
1 gen 2016 anni
16.355
+0.39
2.44%
Classificazione dei paesi secondo i statistiche attuali per anni


Commenti: