29
/it/
it
AIzaSyAYiBZKx7MnpbEhh9jyipgxe19OcubqV5w
April 1, 2024
164850
Jordan
JOR
true
2
1
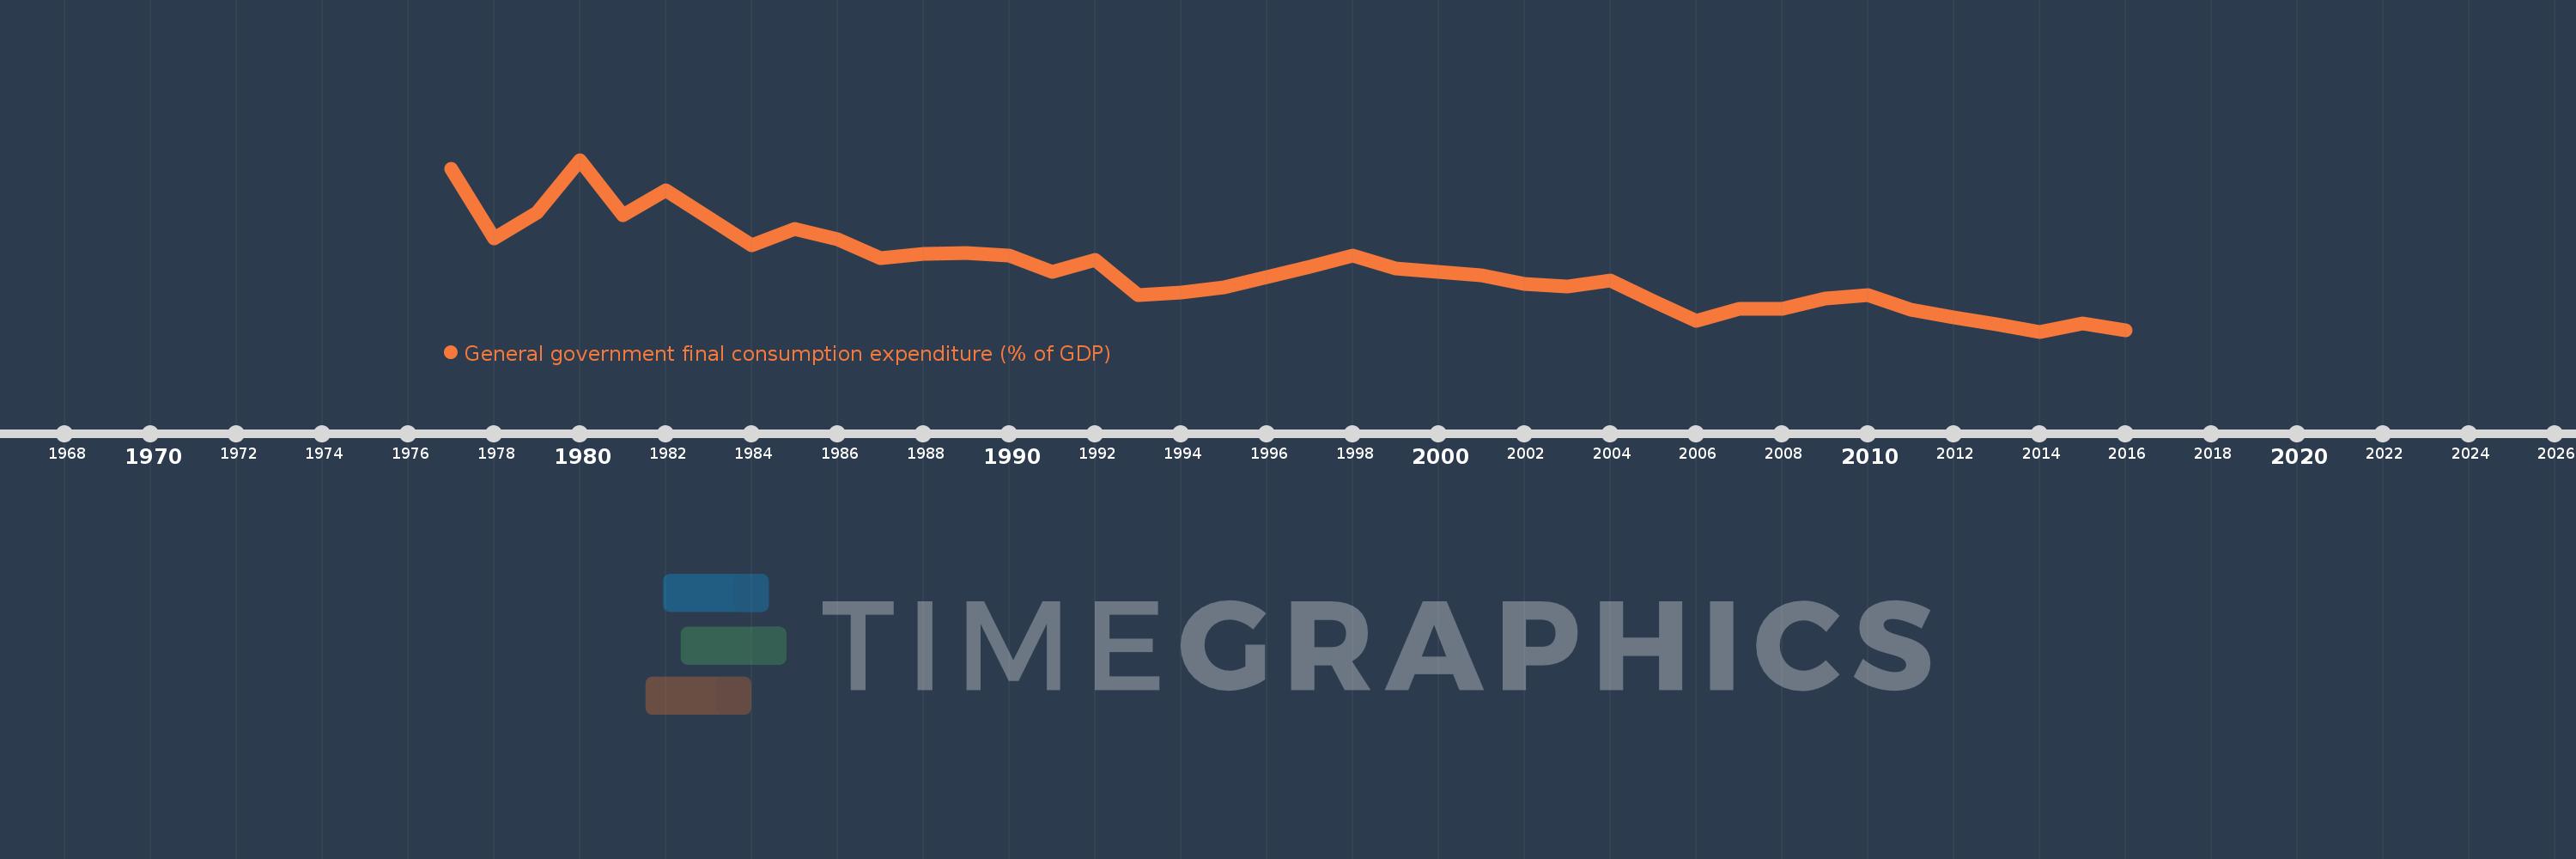
General government final consumption expenditure (% of GDP)
2016,2015,2014,2013,2012,2011,2010,2009,2008,2007,2006,2005,2004,2003,2002,2001,2000,1999,1998,1997,1996,1995,1994,1993,1992,1991,1990,1989,1988,1987,1986,1985,1984,1983,1982,1981,1980,1979,1978,1977
Queste statistiche in altri paesi:
AfghanistanAlbaniaAlgeriaAngolaAntigua and BarbudaArab WorldArgentinaArmeniaArubaAustraliaAustriaAzerbaijanBahamas, TheBahrainBangladeshBarbadosBelarusBelgiumBelizeBeninBermudaBhutanBoliviaBosnia and HerzegovinaBotswanaBrazilBrunei DarussalamBulgariaBurkina FasoBurundiCabo VerdeCambodiaCameroonCanadaCaribbean small statesCentral African RepublicCentral Europe and the BalticsChadChileChinaColombiaComorosCongo, Dem. Rep.Congo, Rep.Costa RicaCote d'IvoireCroatiaCubaCyprusCzech RepublicDenmarkDjiboutiDominicaDominican RepublicEarly-demographic dividendEast Asia & PacificEast Asia & Pacific (excluding high income)East Asia & Pacific (IDA & IBRD countries)EcuadorEgypt, Arab Rep.El SalvadorEquatorial GuineaEritreaEstoniaEthiopiaEuro areaEurope & Central AsiaEurope & Central Asia (excluding high income)Europe & Central Asia (IDA & IBRD countries)European UnionFaroe IslandsFijiFinlandFragile and conflict affected situationsFranceFrench PolynesiaGabonGambia, TheGeorgiaGermanyGhanaGreeceGrenadaGuatemalaGuineaGuinea-BissauGuyanaHaitiHeavily indebted poor countries (HIPC)High incomeHondurasHong Kong SAR, ChinaHungaryIBRD onlyIcelandIDA & IBRD totalIDA blendIDA onlyIDA totalIndiaIndonesiaIran, Islamic Rep.IraqIrelandIsraelItalyJamaicaJapanJordanKazakhstanKenyaKiribatiKorea, Rep.KosovoKuwaitKyrgyz RepublicLao PDRLate-demographic dividendLatin America & Caribbean Latin America & Caribbean (excluding high income)Latin America & the Caribbean (IDA & IBRD countries)LatviaLeast developed countries: UN classificationLebanonLesothoLiberiaLibyaLithuaniaLow & middle incomeLow incomeLower middle incomeLuxembourgMacao SAR, ChinaMacedonia, FYRMadagascarMalawiMalaysiaMaldivesMaliMaltaMauritaniaMauritiusMexicoMicronesia, Fed. Sts.Middle East & North AfricaMiddle East & North Africa (excluding high income)Middle East & North Africa (IDA & IBRD countries)Middle incomeMoldovaMongoliaMontenegroMoroccoMozambiqueNamibiaNepalNetherlandsNew CaledoniaNew ZealandNicaraguaNigerNigeriaNorth AmericaNorwayOECD membersOmanOther small statesPacific island small statesPakistanPanamaPapua New GuineaParaguayPeruPhilippinesPolandPortugalPost-demographic dividendPre-demographic dividendPuerto RicoQatarRomaniaRussian FederationRwandaSaudi ArabiaSenegalSerbiaSeychellesSierra LeoneSingaporeSlovak RepublicSloveniaSmall statesSolomon IslandsSomaliaSouth AfricaSouth AsiaSouth Asia (IDA & IBRD)South SudanSpainSri LankaSt. Kitts and NevisSt. LuciaSt. Vincent and the GrenadinesSub-Saharan Africa Sub-Saharan Africa (excluding high income)Sub-Saharan Africa (IDA & IBRD countries)SudanSurinameSwazilandSwedenSwitzerlandSyrian Arab RepublicTajikistanTanzaniaThailandTimor-LesteTogoTongaTrinidad and TobagoTunisiaTurkeyTurkmenistanUgandaUkraineUnited Arab EmiratesUnited KingdomUnited StatesUpper middle incomeUruguayUzbekistanVanuatuVenezuela, RBVietnamWest Bank and GazaWorldYemen, Rep.ZambiaZimbabwe Linea del tempo:
Questa scala temporale mostra un grafico dal 1977 anno al 2016 anno. Jordan. I dati fino ad 1976 anno non disponibili. Il numero di osservazioni attuali secondo i date: 40.
La fonte (nome):
Indicatori dello sviluppo mondiale
La fonte (organizzazione):
World Bank national accounts data, and OECD National Accounts data files.
Categorie:
Economy & Growth
sono stati aggiornati
23 apr 2017 anni
Indicatori delle variazioni dei valori per anni
Minima:
18.537
1 gen 2014 anni
Massimo:
34.31
1 gen 1980 anni
Alla data di osservazione
Valore
Variazione assoluta
La variazione rispetto al valore precedente
1 gen 1977 anni
33.51
+33.51
0.0%
1 gen 1978 anni
27.115
-6.395
-19.08%
1 gen 1979 anni
29.469
+2.355
8.68%
1 gen 1980 anni
34.31
+4.841
16.43%
1 gen 1981 anni
29.207
-5.104
-14.88%
1 gen 1982 anni
31.504
+2.297
7.87%
1 gen 1983 anni
28.965
-2.539
-8.06%
1 gen 1984 anni
26.497
-2.468
-8.52%
1 gen 1985 anni
27.994
+1.497
5.65%
1 gen 1986 anni
26.982
-1.012
-3.61%
1 gen 1987 anni
25.285
-1.697
-6.29%
1 gen 1988 anni
25.656
+0.372
1.47%
1 gen 1989 anni
25.72
+0.063
0.25%
1 gen 1990 anni
25.514
-0.206
-0.8%
1 gen 1991 anni
24.046
-1.468
-5.75%
1 gen 1992 anni
25.085
+1.039
4.32%
1 gen 1993 anni
21.896
-3.188
-12.71%
1 gen 1994 anni
22.086
+0.19
0.87%
1 gen 1995 anni
22.614
+0.528
2.39%
1 gen 1996 anni
23.571
+0.957
4.23%
1 gen 1997 anni
24.512
+0.941
3.99%
1 gen 1998 anni
25.554
+1.041
4.25%
1 gen 1999 anni
24.373
-1.18
-4.62%
1 gen 2000 anni
24.006
-0.368
-1.51%
1 gen 2001 anni
23.706
-0.299
-1.25%
1 gen 2002 anni
22.924
-0.783
-3.3%
1 gen 2003 anni
22.696
-0.228
-0.99%
1 gen 2004 anni
23.191
+0.495
2.18%
1 gen 2005 anni
21.304
-1.886
-8.13%
1 gen 2006 anni
19.531
-1.774
-8.33%
1 gen 2007 anni
20.639
+1.108
5.67%
1 gen 2008 anni
20.603
-0.036
-0.18%
1 gen 2009 anni
21.571
+0.968
4.7%
1 gen 2010 anni
21.876
+0.306
1.42%
1 gen 2011 anni
20.532
-1.344
-6.15%
1 gen 2012 anni
19.839
-0.693
-3.38%
1 gen 2013 anni
19.192
-0.647
-3.26%
1 gen 2014 anni
18.537
-0.655
-3.41%
1 gen 2015 anni
19.322
+0.785
4.23%
1 gen 2016 anni
18.692
-0.63
-3.26%
Classificazione dei paesi secondo i statistiche attuali per anni


Commenti: