29
/it/
it
AIzaSyAYiBZKx7MnpbEhh9jyipgxe19OcubqV5w
April 1, 2024
159419
Ireland
IRL
true
2
1
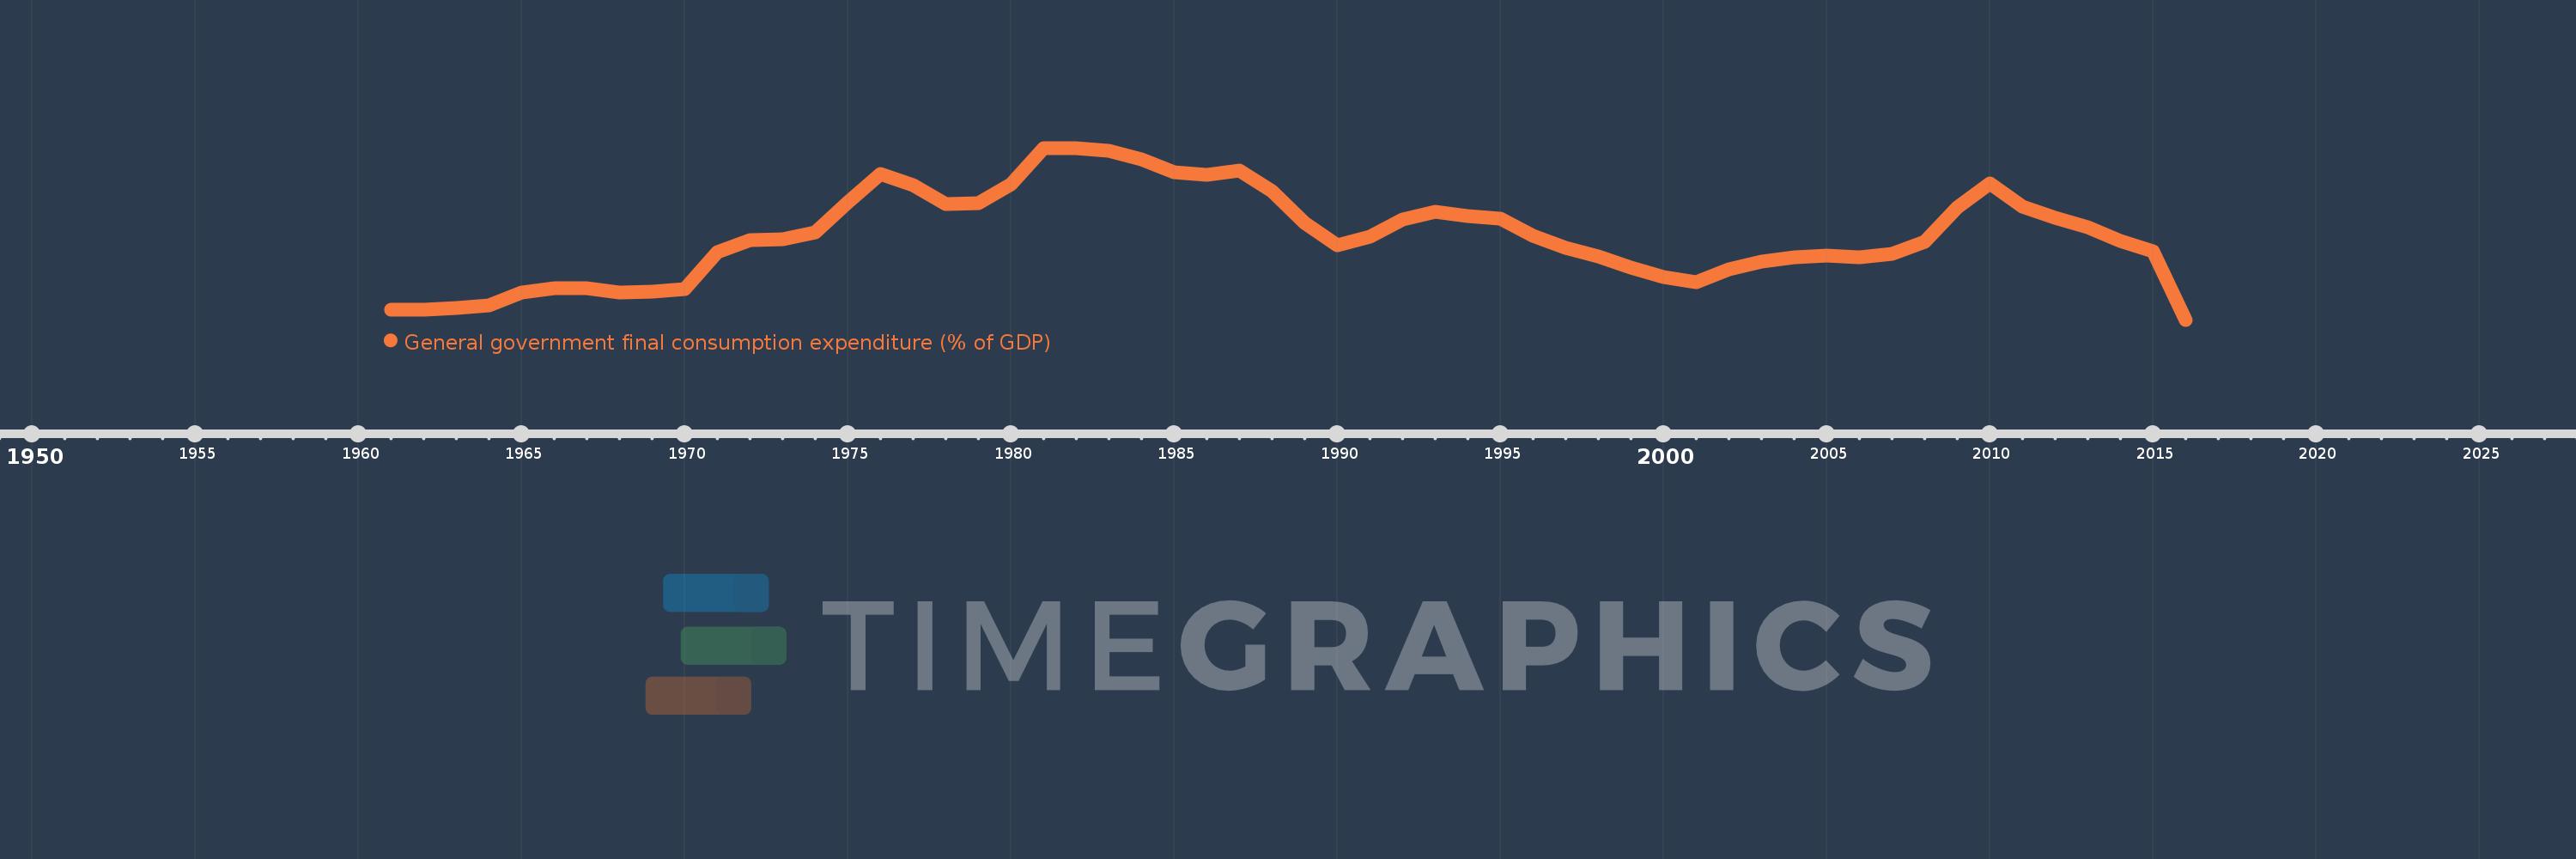
General government final consumption expenditure (% of GDP)
2016,2015,2014,2013,2012,2011,2010,2009,2008,2007,2006,2005,2004,2003,2002,2001,2000,1999,1998,1997,1996,1995,1994,1993,1992,1991,1990,1989,1988,1987,1986,1985,1984,1983,1982,1981,1980,1979,1978,1977,1976,1975,1974,1973,1972,1971,1970,1969,1968,1967,1966,1965,1964,1963,1962,1961
Queste statistiche in altri paesi:
AfghanistanAlbaniaAlgeriaAngolaAntigua and BarbudaArab WorldArgentinaArmeniaArubaAustraliaAustriaAzerbaijanBahamas, TheBahrainBangladeshBarbadosBelarusBelgiumBelizeBeninBermudaBhutanBoliviaBosnia and HerzegovinaBotswanaBrazilBrunei DarussalamBulgariaBurkina FasoBurundiCabo VerdeCambodiaCameroonCanadaCaribbean small statesCentral African RepublicCentral Europe and the BalticsChadChileChinaColombiaComorosCongo, Dem. Rep.Congo, Rep.Costa RicaCote d'IvoireCroatiaCubaCyprusCzech RepublicDenmarkDjiboutiDominicaDominican RepublicEarly-demographic dividendEast Asia & PacificEast Asia & Pacific (excluding high income)East Asia & Pacific (IDA & IBRD countries)EcuadorEgypt, Arab Rep.El SalvadorEquatorial GuineaEritreaEstoniaEthiopiaEuro areaEurope & Central AsiaEurope & Central Asia (excluding high income)Europe & Central Asia (IDA & IBRD countries)European UnionFaroe IslandsFijiFinlandFragile and conflict affected situationsFranceFrench PolynesiaGabonGambia, TheGeorgiaGermanyGhanaGreeceGrenadaGuatemalaGuineaGuinea-BissauGuyanaHaitiHeavily indebted poor countries (HIPC)High incomeHondurasHong Kong SAR, ChinaHungaryIBRD onlyIcelandIDA & IBRD totalIDA blendIDA onlyIDA totalIndiaIndonesiaIran, Islamic Rep.IraqIrelandIsraelItalyJamaicaJapanJordanKazakhstanKenyaKiribatiKorea, Rep.KosovoKuwaitKyrgyz RepublicLao PDRLate-demographic dividendLatin America & Caribbean Latin America & Caribbean (excluding high income)Latin America & the Caribbean (IDA & IBRD countries)LatviaLeast developed countries: UN classificationLebanonLesothoLiberiaLibyaLithuaniaLow & middle incomeLow incomeLower middle incomeLuxembourgMacao SAR, ChinaMacedonia, FYRMadagascarMalawiMalaysiaMaldivesMaliMaltaMauritaniaMauritiusMexicoMicronesia, Fed. Sts.Middle East & North AfricaMiddle East & North Africa (excluding high income)Middle East & North Africa (IDA & IBRD countries)Middle incomeMoldovaMongoliaMontenegroMoroccoMozambiqueNamibiaNepalNetherlandsNew CaledoniaNew ZealandNicaraguaNigerNigeriaNorth AmericaNorwayOECD membersOmanOther small statesPacific island small statesPakistanPanamaPapua New GuineaParaguayPeruPhilippinesPolandPortugalPost-demographic dividendPre-demographic dividendPuerto RicoQatarRomaniaRussian FederationRwandaSaudi ArabiaSenegalSerbiaSeychellesSierra LeoneSingaporeSlovak RepublicSloveniaSmall statesSolomon IslandsSomaliaSouth AfricaSouth AsiaSouth Asia (IDA & IBRD)South SudanSpainSri LankaSt. Kitts and NevisSt. LuciaSt. Vincent and the GrenadinesSub-Saharan Africa Sub-Saharan Africa (excluding high income)Sub-Saharan Africa (IDA & IBRD countries)SudanSurinameSwazilandSwedenSwitzerlandSyrian Arab RepublicTajikistanTanzaniaThailandTimor-LesteTogoTongaTrinidad and TobagoTunisiaTurkeyTurkmenistanUgandaUkraineUnited Arab EmiratesUnited KingdomUnited StatesUpper middle incomeUruguayUzbekistanVanuatuVenezuela, RBVietnamWest Bank and GazaWorldYemen, Rep.ZambiaZimbabwe Linea del tempo:
Questa scala temporale mostra un grafico dal 1961 anno al 2016 anno. Ireland. I dati fino ad 1960 anno non disponibili. Il numero di osservazioni attuali secondo i date: 56.
La fonte (nome):
Indicatori dello sviluppo mondiale
La fonte (organizzazione):
World Bank national accounts data, and OECD National Accounts data files.
Categorie:
Economy & Growth
sono stati aggiornati
23 apr 2017 anni
Indicatori delle variazioni dei valori per anni
Minima:
12.549
1 gen 2016 anni
Massimo:
22.167
1 gen 1982 anni
Alla data di osservazione
Valore
Variazione assoluta
La variazione rispetto al valore precedente
1 gen 1961 anni
13.126
+13.126
0.0%
1 gen 1962 anni
13.106
-0.02
-0.15%
1 gen 1963 anni
13.21
+0.104
0.79%
1 gen 1964 anni
13.363
+0.153
1.16%
1 gen 1965 anni
14.059
+0.696
5.21%
1 gen 1966 anni
14.336
+0.278
1.97%
1 gen 1967 anni
14.315
-0.022
-0.15%
1 gen 1968 anni
14.081
-0.233
-1.63%
1 gen 1969 anni
14.131
+0.05
0.35%
1 gen 1970 anni
14.264
+0.133
0.94%
1 gen 1971 anni
16.316
+2.052
14.39%
1 gen 1972 anni
16.983
+0.667
4.09%
1 gen 1973 anni
17.077
+0.095
0.56%
1 gen 1974 anni
17.438
+0.361
2.11%
1 gen 1975 anni
19.133
+1.695
9.72%
1 gen 1976 anni
20.72
+1.587
8.3%
1 gen 1977 anni
20.096
-0.624
-3.01%
1 gen 1978 anni
19.003
-1.093
-5.44%
1 gen 1979 anni
19.056
+0.053
0.28%
1 gen 1980 anni
20.14
+1.084
5.69%
1 gen 1981 anni
22.138
+1.998
9.92%
1 gen 1982 anni
22.167
+0.029
0.13%
1 gen 1983 anni
22.028
-0.139
-0.63%
1 gen 1984 anni
21.537
-0.491
-2.23%
1 gen 1985 anni
20.822
-0.715
-3.32%
1 gen 1986 anni
20.67
-0.152
-0.73%
1 gen 1987 anni
20.905
+0.235
1.14%
1 gen 1988 anni
19.726
-1.18
-5.64%
1 gen 1989 anni
17.979
-1.746
-8.85%
1 gen 1990 anni
16.697
-1.282
-7.13%
1 gen 1991 anni
17.183
+0.486
2.91%
1 gen 1992 anni
18.176
+0.994
5.78%
1 gen 1993 anni
18.573
+0.397
2.18%
1 gen 1994 anni
18.367
-0.206
-1.11%
1 gen 1995 anni
18.188
-0.179
-0.97%
1 gen 1996 anni
17.24
-0.948
-5.21%
1 gen 1997 anni
16.592
-0.649
-3.76%
1 gen 1998 anni
16.101
-0.49
-2.95%
1 gen 1999 anni
15.492
-0.609
-3.78%
1 gen 2000 anni
14.931
-0.562
-3.62%
1 gen 2001 anni
14.673
-0.257
-1.72%
1 gen 2002 anni
15.357
+0.684
4.66%
1 gen 2003 anni
15.781
+0.425
2.76%
1 gen 2004 anni
16.032
+0.251
1.59%
1 gen 2005 anni
16.139
+0.107
0.67%
1 gen 2006 anni
16.04
-0.099
-0.61%
1 gen 2007 anni
16.249
+0.208
1.3%
1 gen 2008 anni
16.91
+0.662
4.07%
1 gen 2009 anni
18.822
+1.912
11.3%
1 gen 2010 anni
20.193
+1.371
7.28%
1 gen 2011 anni
18.9
-1.292
-6.4%
1 gen 2012 anni
18.249
-0.652
-3.45%
1 gen 2013 anni
17.719
-0.529
-2.9%
1 gen 2014 anni
16.976
-0.743
-4.19%
1 gen 2015 anni
16.398
-0.579
-3.41%
1 gen 2016 anni
12.549
-3.849
-23.47%
Classificazione dei paesi secondo i statistiche attuali per anni


Commenti: