29
/it/
it
AIzaSyAYiBZKx7MnpbEhh9jyipgxe19OcubqV5w
April 1, 2024
107256
Colombia
COL
true
2
1
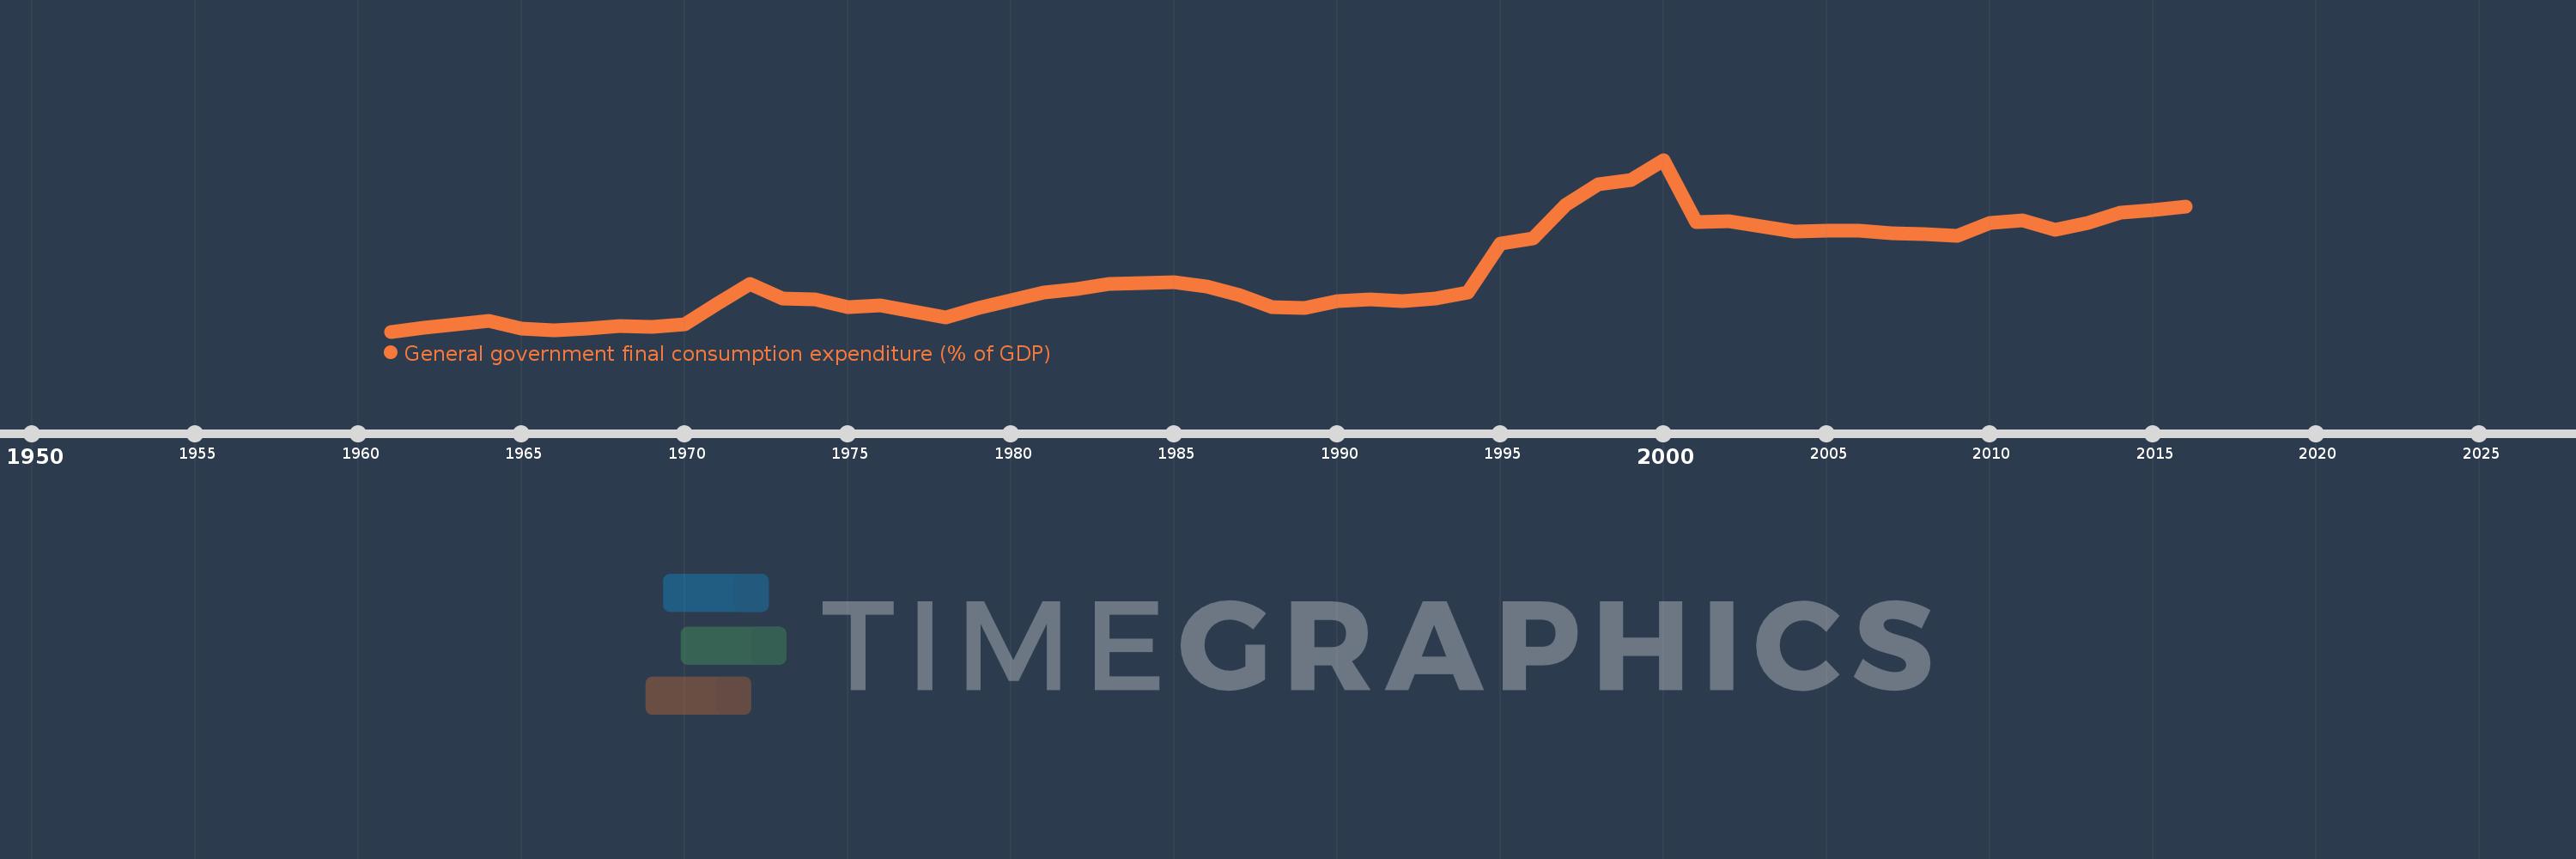
General government final consumption expenditure (% of GDP)
2016,2015,2014,2013,2012,2011,2010,2009,2008,2007,2006,2005,2004,2003,2002,2001,2000,1999,1998,1997,1996,1995,1994,1993,1992,1991,1990,1989,1988,1987,1986,1985,1984,1983,1982,1981,1980,1979,1978,1977,1976,1975,1974,1973,1972,1971,1970,1969,1968,1967,1966,1965,1964,1963,1962,1961
Queste statistiche in altri paesi:
AfghanistanAlbaniaAlgeriaAngolaAntigua and BarbudaArab WorldArgentinaArmeniaArubaAustraliaAustriaAzerbaijanBahamas, TheBahrainBangladeshBarbadosBelarusBelgiumBelizeBeninBermudaBhutanBoliviaBosnia and HerzegovinaBotswanaBrazilBrunei DarussalamBulgariaBurkina FasoBurundiCabo VerdeCambodiaCameroonCanadaCaribbean small statesCentral African RepublicCentral Europe and the BalticsChadChileChinaColombiaComorosCongo, Dem. Rep.Congo, Rep.Costa RicaCote d'IvoireCroatiaCubaCyprusCzech RepublicDenmarkDjiboutiDominicaDominican RepublicEarly-demographic dividendEast Asia & PacificEast Asia & Pacific (excluding high income)East Asia & Pacific (IDA & IBRD countries)EcuadorEgypt, Arab Rep.El SalvadorEquatorial GuineaEritreaEstoniaEthiopiaEuro areaEurope & Central AsiaEurope & Central Asia (excluding high income)Europe & Central Asia (IDA & IBRD countries)European UnionFaroe IslandsFijiFinlandFragile and conflict affected situationsFranceFrench PolynesiaGabonGambia, TheGeorgiaGermanyGhanaGreeceGrenadaGuatemalaGuineaGuinea-BissauGuyanaHaitiHeavily indebted poor countries (HIPC)High incomeHondurasHong Kong SAR, ChinaHungaryIBRD onlyIcelandIDA & IBRD totalIDA blendIDA onlyIDA totalIndiaIndonesiaIran, Islamic Rep.IraqIrelandIsraelItalyJamaicaJapanJordanKazakhstanKenyaKiribatiKorea, Rep.KosovoKuwaitKyrgyz RepublicLao PDRLate-demographic dividendLatin America & Caribbean Latin America & Caribbean (excluding high income)Latin America & the Caribbean (IDA & IBRD countries)LatviaLeast developed countries: UN classificationLebanonLesothoLiberiaLibyaLithuaniaLow & middle incomeLow incomeLower middle incomeLuxembourgMacao SAR, ChinaMacedonia, FYRMadagascarMalawiMalaysiaMaldivesMaliMaltaMauritaniaMauritiusMexicoMicronesia, Fed. Sts.Middle East & North AfricaMiddle East & North Africa (excluding high income)Middle East & North Africa (IDA & IBRD countries)Middle incomeMoldovaMongoliaMontenegroMoroccoMozambiqueNamibiaNepalNetherlandsNew CaledoniaNew ZealandNicaraguaNigerNigeriaNorth AmericaNorwayOECD membersOmanOther small statesPacific island small statesPakistanPanamaPapua New GuineaParaguayPeruPhilippinesPolandPortugalPost-demographic dividendPre-demographic dividendPuerto RicoQatarRomaniaRussian FederationRwandaSaudi ArabiaSenegalSerbiaSeychellesSierra LeoneSingaporeSlovak RepublicSloveniaSmall statesSolomon IslandsSomaliaSouth AfricaSouth AsiaSouth Asia (IDA & IBRD)South SudanSpainSri LankaSt. Kitts and NevisSt. LuciaSt. Vincent and the GrenadinesSub-Saharan Africa Sub-Saharan Africa (excluding high income)Sub-Saharan Africa (IDA & IBRD countries)SudanSurinameSwazilandSwedenSwitzerlandSyrian Arab RepublicTajikistanTanzaniaThailandTimor-LesteTogoTongaTrinidad and TobagoTunisiaTurkeyTurkmenistanUgandaUkraineUnited Arab EmiratesUnited KingdomUnited StatesUpper middle incomeUruguayUzbekistanVanuatuVenezuela, RBVietnamWest Bank and GazaWorldYemen, Rep.ZambiaZimbabwe Linea del tempo:
Questa scala temporale mostra un grafico dal 1961 anno al 2016 anno. Colombia. I dati fino ad 1960 anno non disponibili. Il numero di osservazioni attuali secondo i date: 56.
La fonte (nome):
Indicatori dello sviluppo mondiale
La fonte (organizzazione):
World Bank national accounts data, and OECD National Accounts data files.
Categorie:
Economy & Growth
sono stati aggiornati
23 apr 2017 anni
Indicatori delle variazioni dei valori per anni
Minima:
6.361
1 gen 1961 anni
Massimo:
22.734
1 gen 2000 anni
Alla data di osservazione
Valore
Variazione assoluta
La variazione rispetto al valore precedente
1 gen 1961 anni
6.361
+6.361
0.0%
1 gen 1962 anni
6.763
+0.402
6.32%
1 gen 1963 anni
7.029
+0.266
3.93%
1 gen 1964 anni
7.41
+0.381
5.43%
1 gen 1965 anni
6.628
-0.782
-10.56%
1 gen 1966 anni
6.504
-0.124
-1.87%
1 gen 1967 anni
6.671
+0.167
2.56%
1 gen 1968 anni
6.881
+0.21
3.15%
1 gen 1969 anni
6.824
-0.057
-0.83%
1 gen 1970 anni
7.06
+0.236
3.45%
1 gen 1971 anni
9.038
+1.979
28.03%
1 gen 1972 anni
10.905
+1.867
20.66%
1 gen 1973 anni
9.493
-1.412
-12.95%
1 gen 1974 anni
9.459
-0.034
-0.36%
1 gen 1975 anni
8.685
-0.773
-8.18%
1 gen 1976 anni
8.887
+0.201
2.32%
1 gen 1977 anni
8.266
-0.62
-6.98%
1 gen 1978 anni
7.681
-0.585
-7.08%
1 gen 1979 anni
8.576
+0.895
11.65%
1 gen 1980 anni
9.337
+0.761
8.87%
1 gen 1981 anni
10.069
+0.732
7.84%
1 gen 1982 anni
10.44
+0.371
3.69%
1 gen 1983 anni
10.932
+0.492
4.71%
1 gen 1984 anni
10.969
+0.037
0.34%
1 gen 1985 anni
11.046
+0.077
0.7%
1 gen 1986 anni
10.693
-0.353
-3.2%
1 gen 1987 anni
9.809
-0.884
-8.27%
1 gen 1988 anni
8.703
-1.106
-11.27%
1 gen 1989 anni
8.635
-0.068
-0.78%
1 gen 1990 anni
9.229
+0.594
6.88%
1 gen 1991 anni
9.393
+0.164
1.78%
1 gen 1992 anni
9.247
-0.146
-1.56%
1 gen 1993 anni
9.548
+0.301
3.26%
1 gen 1994 anni
10.078
+0.53
5.55%
1 gen 1995 anni
14.716
+4.638
46.02%
1 gen 1996 anni
15.237
+0.521
3.54%
1 gen 1997 anni
18.465
+3.228
21.19%
1 gen 1998 anni
20.411
+1.947
10.54%
1 gen 1999 anni
20.836
+0.425
2.08%
1 gen 2000 anni
22.734
+1.898
9.11%
1 gen 2001 anni
16.791
-5.944
-26.14%
1 gen 2002 anni
16.886
+0.095
0.57%
1 gen 2003 anni
16.372
-0.514
-3.04%
1 gen 2004 anni
15.928
-0.444
-2.71%
1 gen 2005 anni
15.989
+0.061
0.38%
1 gen 2006 anni
16.003
+0.014
0.09%
1 gen 2007 anni
15.702
-0.301
-1.88%
1 gen 2008 anni
15.641
-0.061
-0.39%
1 gen 2009 anni
15.518
-0.124
-0.79%
1 gen 2010 anni
16.705
+1.187
7.65%
1 gen 2011 anni
16.928
+0.224
1.34%
1 gen 2012 anni
16.095
-0.833
-4.92%
1 gen 2013 anni
16.677
+0.582
3.61%
1 gen 2014 anni
17.696
+1.02
6.11%
1 gen 2015 anni
17.931
+0.235
1.33%
1 gen 2016 anni
18.242
+0.311
1.73%
Classificazione dei paesi secondo i statistiche attuali per anni


Commenti: