29
/it/
it
AIzaSyAYiBZKx7MnpbEhh9jyipgxe19OcubqV5w
April 1, 2024
24999
Caribbean small states
CSS
false
2
1
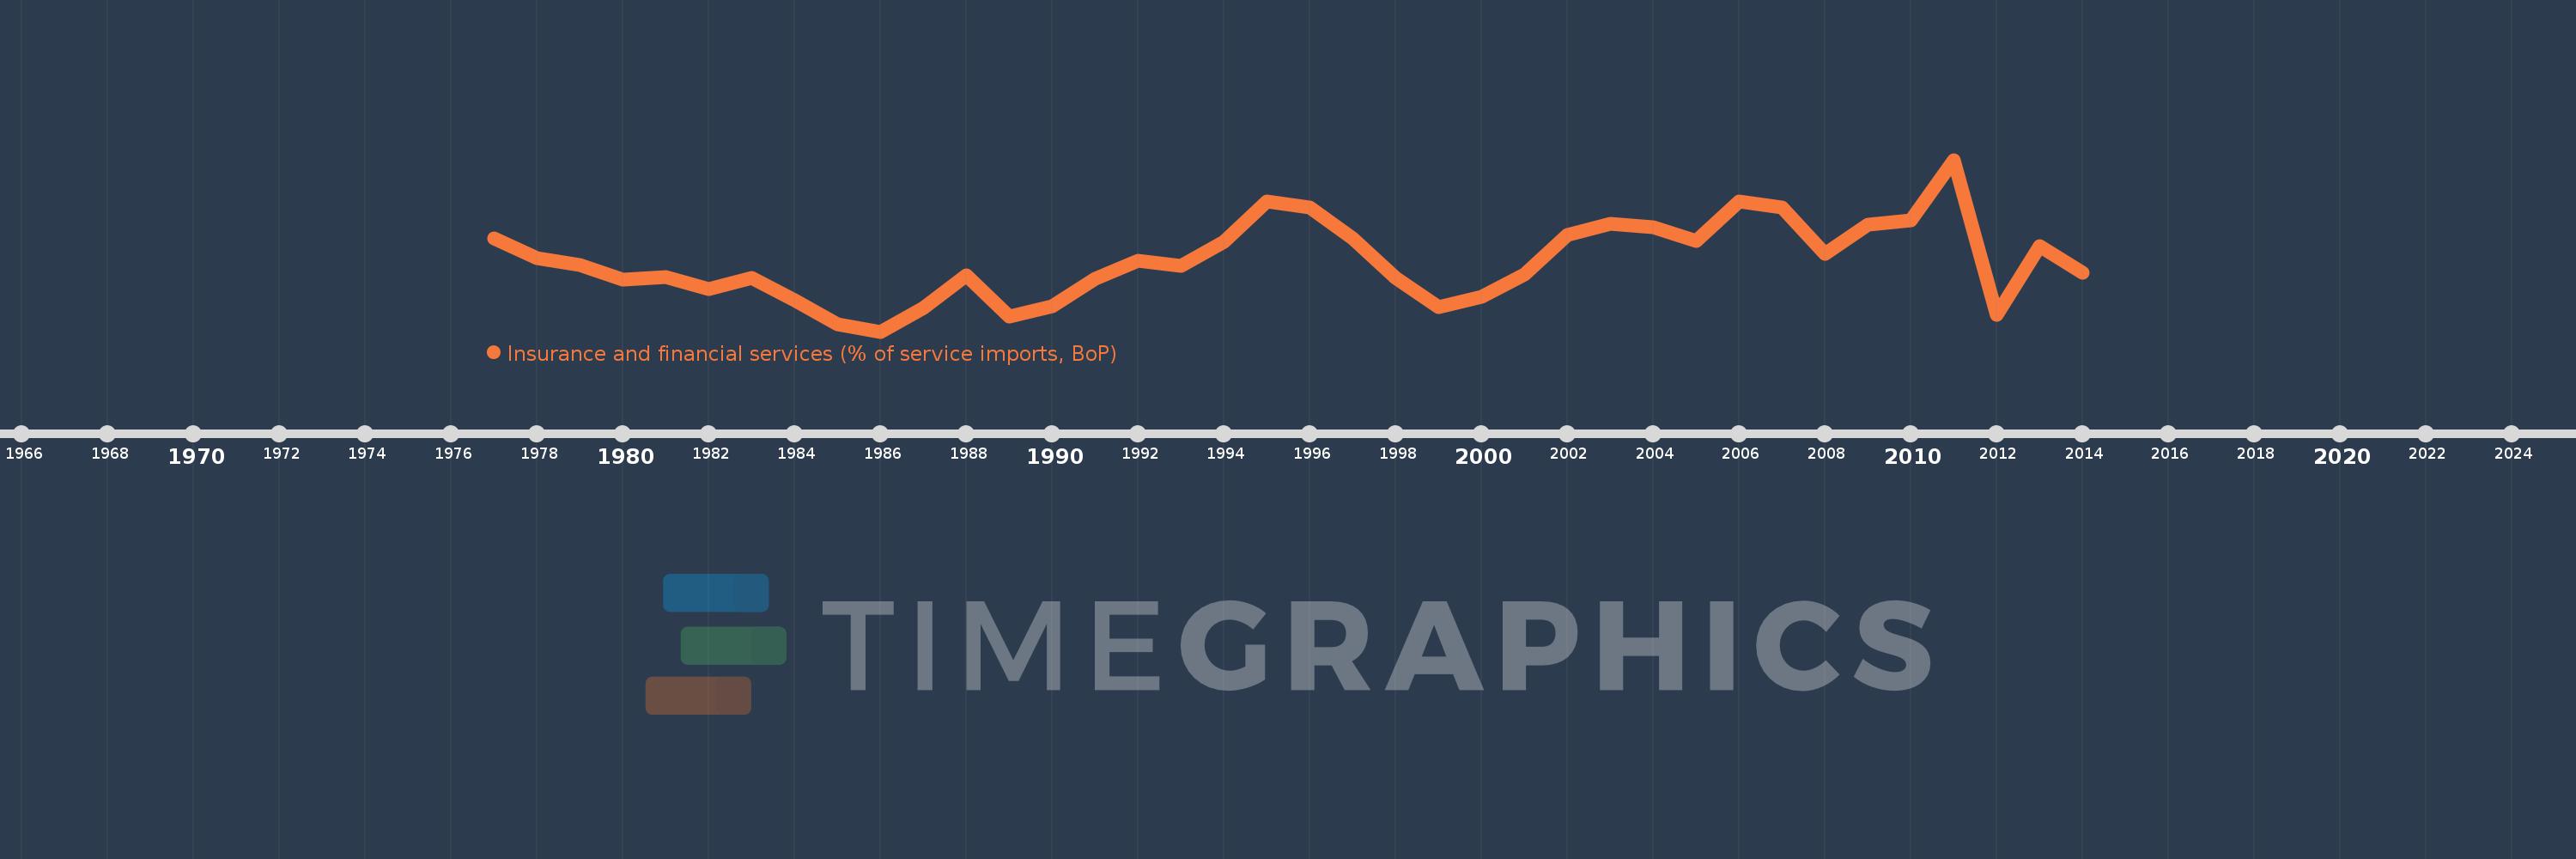
Insurance and financial services (% of service imports, BoP)
2014,2013,2012,2011,2010,2009,2008,2007,2006,2005,2004,2003,2002,2001,2000,1999,1998,1997,1996,1995,1994,1993,1992,1991,1990,1989,1988,1987,1986,1985,1984,1983,1982,1981,1980,1979,1978,1977
Queste statistiche in altri paesi:
AfghanistanAlbaniaAlgeriaAngolaAntigua and BarbudaArab WorldArgentinaArmeniaArubaAustraliaAustriaAzerbaijanBahamas, TheBahrainBangladeshBarbadosBelarusBelgiumBelizeBeninBermudaBhutanBoliviaBosnia and HerzegovinaBotswanaBrazilBrunei DarussalamBulgariaBurkina FasoBurundiCabo VerdeCambodiaCameroonCanadaCaribbean small statesCentral African RepublicCentral Europe and the BalticsChadChileChinaColombiaComorosCongo, Dem. Rep.Congo, Rep.Costa RicaCote d'IvoireCroatiaCuracaoCyprusCzech RepublicDenmarkDjiboutiDominicaDominican RepublicEarly-demographic dividendEast Asia & PacificEast Asia & Pacific (excluding high income)East Asia & Pacific (IDA & IBRD countries)EcuadorEgypt, Arab Rep.El SalvadorEquatorial GuineaEritreaEstoniaEthiopiaEuro areaEurope & Central AsiaEurope & Central Asia (excluding high income)Europe & Central Asia (IDA & IBRD countries)European UnionFaroe IslandsFijiFinlandFragile and conflict affected situationsFranceFrench PolynesiaGabonGambia, TheGeorgiaGermanyGhanaGreeceGrenadaGuatemalaGuineaGuinea-BissauGuyanaHaitiHeavily indebted poor countries (HIPC)High incomeHondurasHong Kong SAR, ChinaHungaryIBRD onlyIcelandIDA & IBRD totalIDA onlyIDA totalIndiaIndonesiaIran, Islamic Rep.IraqIrelandIsraelItalyJamaicaJapanJordanKazakhstanKenyaKiribatiKorea, Rep.KosovoKuwaitKyrgyz RepublicLao PDRLate-demographic dividendLatin America & Caribbean Latin America & Caribbean (excluding high income)Latin America & the Caribbean (IDA & IBRD countries)LatviaLeast developed countries: UN classificationLebanonLesothoLiberiaLibyaLithuaniaLow & middle incomeLow incomeLower middle incomeLuxembourgMacao SAR, ChinaMacedonia, FYRMadagascarMalawiMalaysiaMaldivesMaliMaltaMarshall IslandsMauritaniaMauritiusMexicoMicronesia, Fed. Sts.Middle East & North AfricaMiddle East & North Africa (excluding high income)Middle East & North Africa (IDA & IBRD countries)Middle incomeMoldovaMongoliaMontenegroMoroccoMozambiqueMyanmarNamibiaNepalNetherlandsNew CaledoniaNew ZealandNicaraguaNigerNigeriaNorth AmericaNorwayOECD membersOmanOther small statesPacific island small statesPakistanPalauPanamaPapua New GuineaParaguayPeruPhilippinesPolandPortugalPost-demographic dividendPre-demographic dividendQatarRomaniaRussian FederationRwandaSamoaSao Tome and PrincipeSaudi ArabiaSenegalSerbiaSeychellesSierra LeoneSingaporeSint Maarten (Dutch part)Slovak RepublicSloveniaSmall statesSolomon IslandsSouth AfricaSouth AsiaSouth Asia (IDA & IBRD)South SudanSpainSri LankaSt. Kitts and NevisSt. LuciaSt. Vincent and the GrenadinesSub-Saharan Africa Sub-Saharan Africa (excluding high income)Sub-Saharan Africa (IDA & IBRD countries)SudanSurinameSwazilandSwedenSwitzerlandSyrian Arab RepublicTajikistanTanzaniaThailandTimor-LesteTogoTongaTrinidad and TobagoTunisiaTurkeyTuvaluUgandaUkraineUnited KingdomUnited StatesUpper middle incomeUruguayVanuatuVenezuela, RBWest Bank and GazaWorldYemen, Rep.ZambiaZimbabwe Linea del tempo:
Questa scala temporale mostra un grafico dal 1977 anno al 2014 anno. Caribbean small states. I dati fino ad 1976 anno non disponibili. Il numero di osservazioni attuali secondo i date: 38.
La fonte (nome):
Indicatori dello sviluppo mondiale
La fonte (organizzazione):
International Monetary Fund, Balance of Payments Statistics Yearbook and data files.
Categorie:
Economy & Growth, Private Sector, Trade
sono stati aggiornati
23 apr 2017 anni
Indicatori delle variazioni dei valori per anni
Minima:
7.005
1 gen 1986 anni
Massimo:
12.812
1 gen 2011 anni
Alla data di osservazione
Valore
Variazione assoluta
La variazione rispetto al valore precedente
1 gen 1977 anni
10.147
+10.147
0.0%
1 gen 1978 anni
9.479
-0.668
-6.58%
1 gen 1979 anni
9.249
-0.23
-2.42%
1 gen 1980 anni
8.776
-0.473
-5.12%
1 gen 1981 anni
8.856
+0.08
0.91%
1 gen 1982 anni
8.428
-0.428
-4.83%
1 gen 1983 anni
8.832
+0.404
4.79%
1 gen 1984 anni
8.058
-0.774
-8.76%
1 gen 1985 anni
7.259
-0.799
-9.91%
1 gen 1986 anni
7.005
-0.254
-3.5%
1 gen 1987 anni
7.8
+0.795
11.35%
1 gen 1988 anni
8.908
+1.108
14.2%
1 gen 1989 anni
7.509
-1.399
-15.71%
1 gen 1990 anni
7.853
+0.344
4.58%
1 gen 1991 anni
8.799
+0.947
12.05%
1 gen 1992 anni
9.405
+0.605
6.88%
1 gen 1993 anni
9.229
-0.176
-1.87%
1 gen 1994 anni
10.043
+0.814
8.82%
1 gen 1995 anni
11.399
+1.356
13.51%
1 gen 1996 anni
11.206
-0.193
-1.7%
1 gen 1997 anni
10.149
-1.057
-9.43%
1 gen 1998 anni
8.818
-1.331
-13.11%
1 gen 1999 anni
7.826
-0.992
-11.25%
1 gen 2000 anni
8.185
+0.359
4.59%
1 gen 2001 anni
8.935
+0.749
9.15%
1 gen 2002 anni
10.274
+1.339
14.99%
1 gen 2003 anni
10.648
+0.375
3.65%
1 gen 2004 anni
10.543
-0.105
-0.99%
1 gen 2005 anni
10.064
-0.479
-4.54%
1 gen 2006 anni
11.396
+1.332
13.24%
1 gen 2007 anni
11.196
-0.2
-1.75%
1 gen 2008 anni
9.63
-1.566
-13.99%
1 gen 2009 anni
10.606
+0.976
10.14%
1 gen 2010 anni
10.759
+0.153
1.44%
1 gen 2011 anni
12.812
+2.054
19.09%
1 gen 2012 anni
7.562
-5.251
-40.98%
1 gen 2013 anni
9.892
+2.331
30.82%
1 gen 2014 anni
8.985
-0.908
-9.18%
Classificazione dei paesi secondo i statistiche attuali per anni


Commenti: